Analytics Dashboard
Analytics appears in Standard Mode in the main left navigation.
HYPR Analytics Dashboards are powered by Amazon QuickSight. For documentation on manipulating data points and creating filters, see Reader experience: Exploring interactive dashboards in Amazon QuickSight.
Advanced filter controls can be opened by drilling down on a data point in the graphs and by clicking the filter icon in the upper right of the Risk Reports pane.
HYPR Control Center includes several Dashboards that capture data from Identity Assurance, Authenticate, Adapt, and Affirm to better help you understand what's happening on your server. This feature is enabled by default; contact HYPR Support for assistance if you would like it disabled for your environment.
Common Dashboard Functionality
Each tab at the top level of the page represents a group of dashboards. Under each main tab you'll find some basic controls across the very top row:
-
a Refresh button to obtain the latest data
-
Undo and Redo buttons to grant a little grace for mistakes and repeat actions
-
At the far right, a Filter button for very granular searches
Beneath the top buttons is the Controls bar. Clicking anywhere in the row will toggle this bar to expand or collapse; while collapsed it displays the current filtering attributes. While expanded, the attributes of the report can be selected for or removed from the results. The three-dot menu attached to the drop-down menu will allow you to reset the filter, refresh the view, or open the filter controls at the far right of the panel for more detailed settings. Each main tab's Controls attributes differ, and are described in the main tab descriptions below.
Next is the dashboard title. If another dashboard is in this group, the blue button at right labeled Click here... will take you there.
The central pane houses a group of reports. Hovering over a report block will enable a menu with a few symbols on it.
All hover dialogs always have the following choices:
-
Expand (or shrink) the block in the page (the opposing diagonal arrows)
-
Use the advanced Filter with this block (the funnel)
-
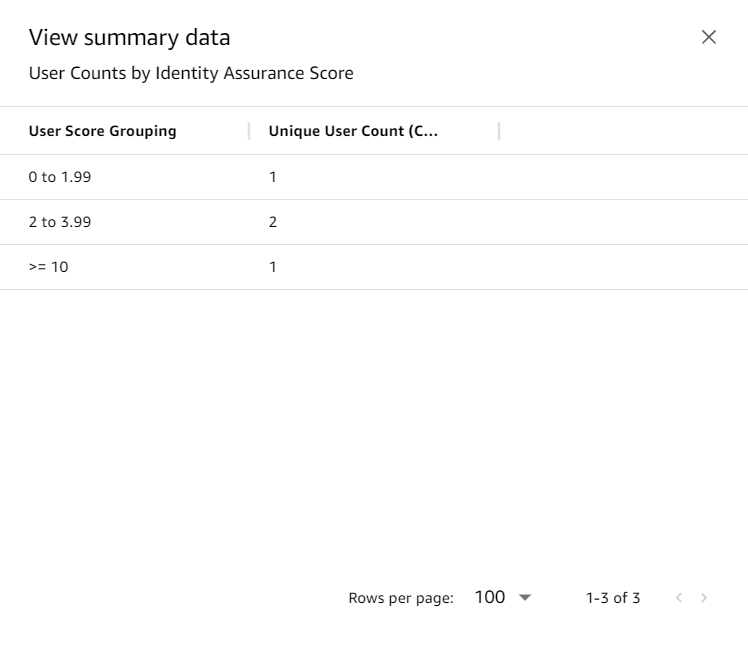
Hover over the three-dot menu to have the options to View summary data or Export to CSV; the summary data looks similar to this:
-
Depending on the data involved in the particular tile, arrows up or down allow you to explore hierarchically by 'drilling' up or down in the data
Identity Assurance Dashboards
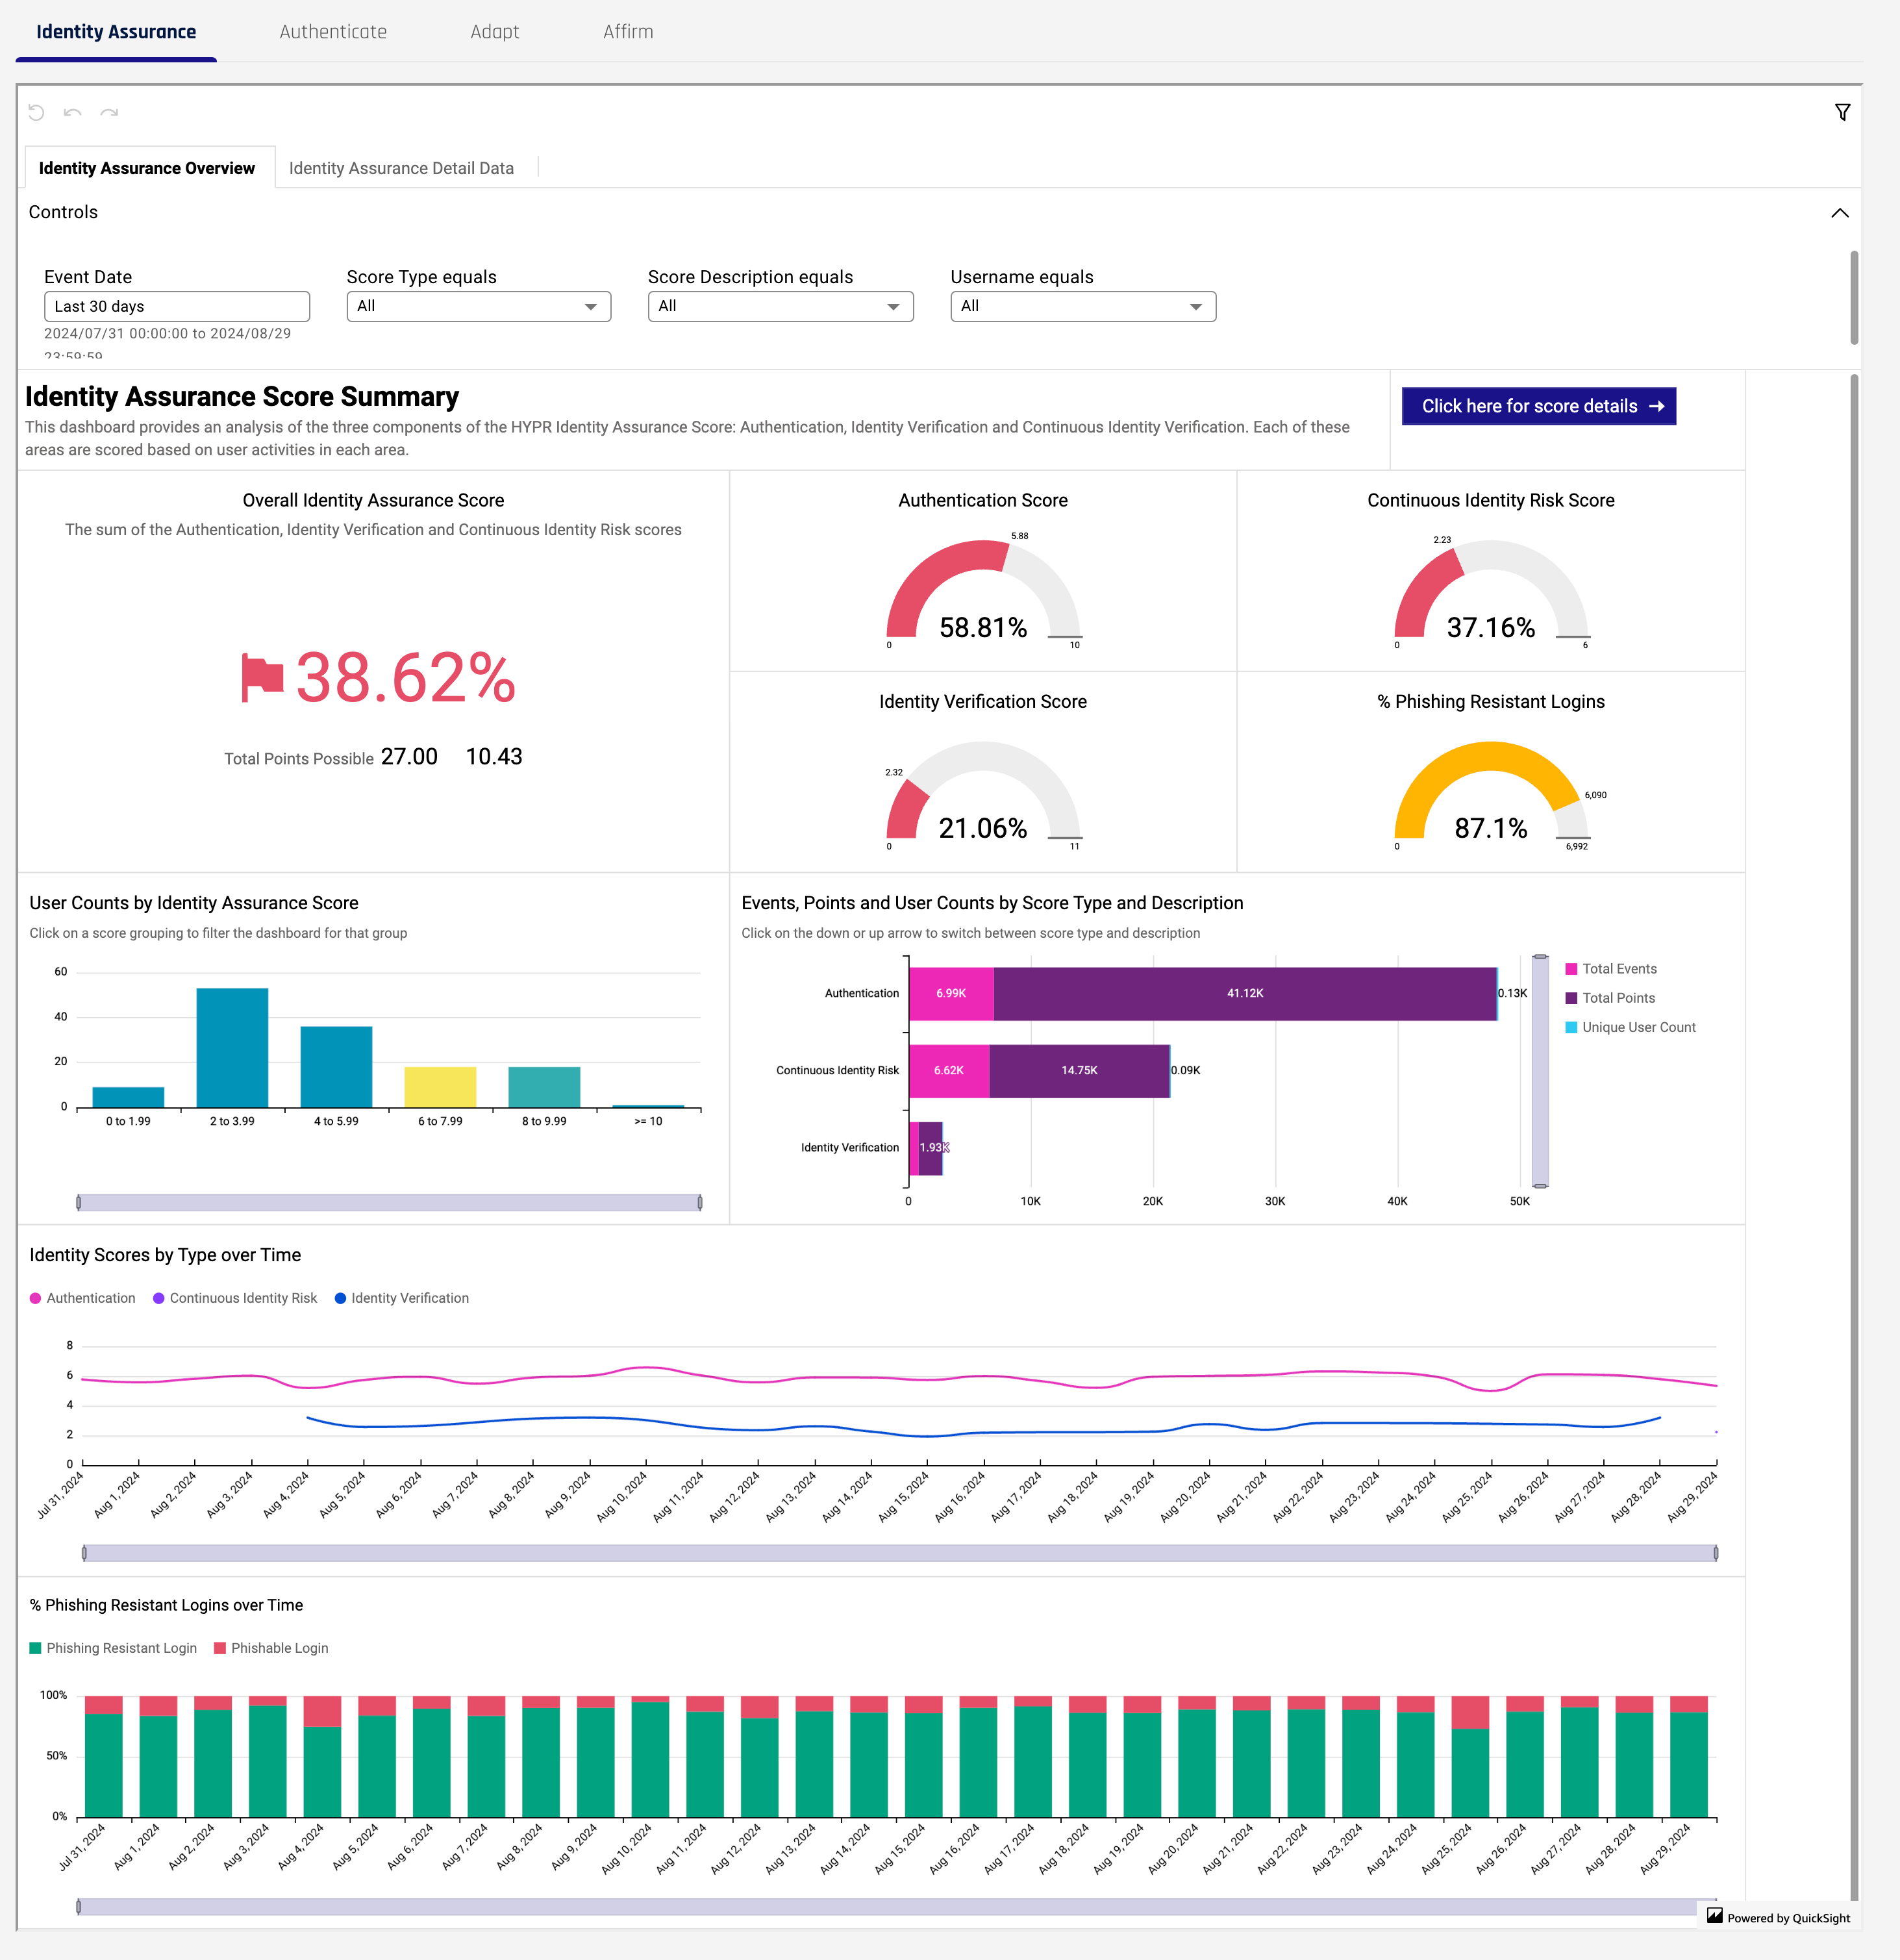
The default tab for the Analytics Dashboard is the Identity Assurance Overview tab. The next tab shows Identity Assurance Detail Data - a more granular view of the data on the Overview pane.
Identity Assurance Dashboards Controls
The filters for both the Overview/Summary and Details panes are identical.
-
Event Date: Opens the QuickSight dialog to set a range of dates
-
Score Type equals: Which type(s) of score do you wish to view? Authentication | Continuous Identity | Identity Verification
-
Score Description equals: Filter on description(s)
-
Username equals: Filter on username(s)
Identity Assurance Score Summary
-
Overall Identity Assurance Score: Based on the elements selected in User Counts by Identity Assurance Score, a sum of the Authentication, Identity Verification, and Continuous Identity Risk scores, which are shown individually to the right of this pane along with the % Phishing Resistant Logins; Note that if there is no data for one of the selected elements, the main Overall Identity Assurance Score pane will display 'Cannot compare values.'
-
User Counts by Identity Assurance Score: Click a bar to filter the reports on the page for that group
-
Events, Points and User Counts by Score Type and Description: Use the up and down arrows in the hover menu to drill up or down on Type and Description
-
Identity Scores by Type over Time: Line chart with can be filtered for type
-
% Phishing Resistant Logins over Time: A bar chart showing both resistant and phishable logins over time
Identity Assurance Detail Data
A detailed report based on the selections made in the Identity Assurance Score Summary tab. Just beneath heading, Identity Assurance Score Detail, the current filters that were applied on the Summary tab are listed to give context to the report.
To show details for all data, reset the filters or refresh the Identity Assurance Score Summary tab.
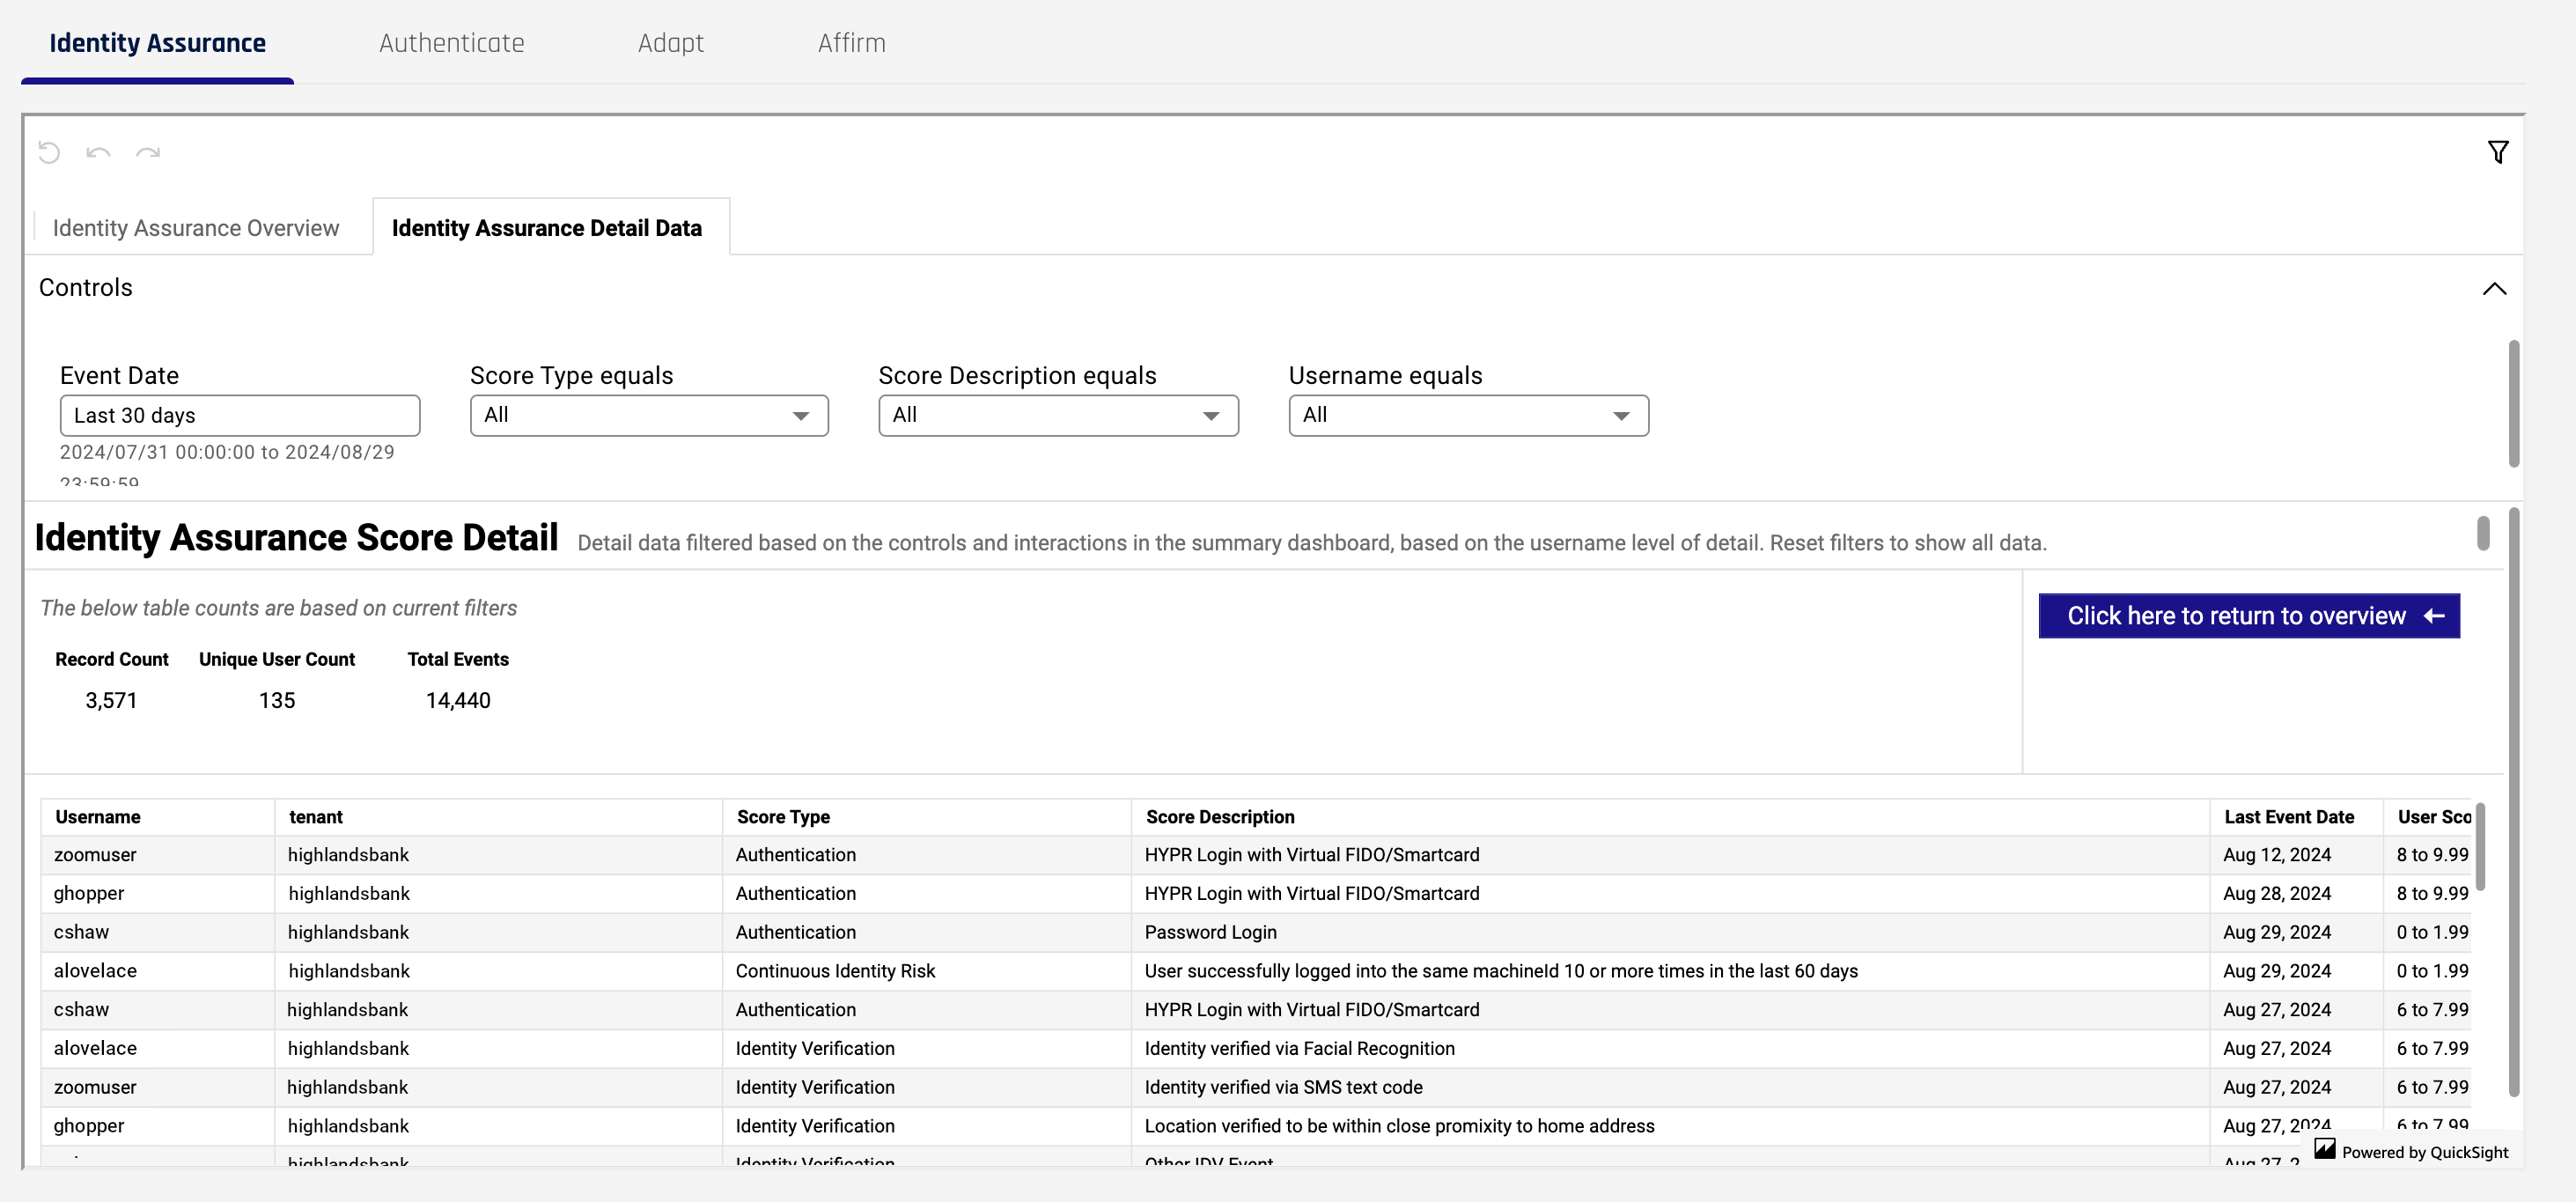
The report consists of the following columns:
-
Username: The individual username for the record
-
tenant: The tenant name; part of the URL
-
Score Type: Authentication | Identity Verification | Continuous Identity Risk
-
Score Description: The description of the score
-
Last Event Date: The last time this event occurred
-
User Score Grouping: In which score range did the user fall?
-
Identity Assurance Score: The actual user score
-
Avg Identity Assurance Score per User: An average of scores for the username
-
Total Points: The number of points accrued when generating the average score
-
Total Events: The number of events used in generating the average score
Authenticate Dashboard
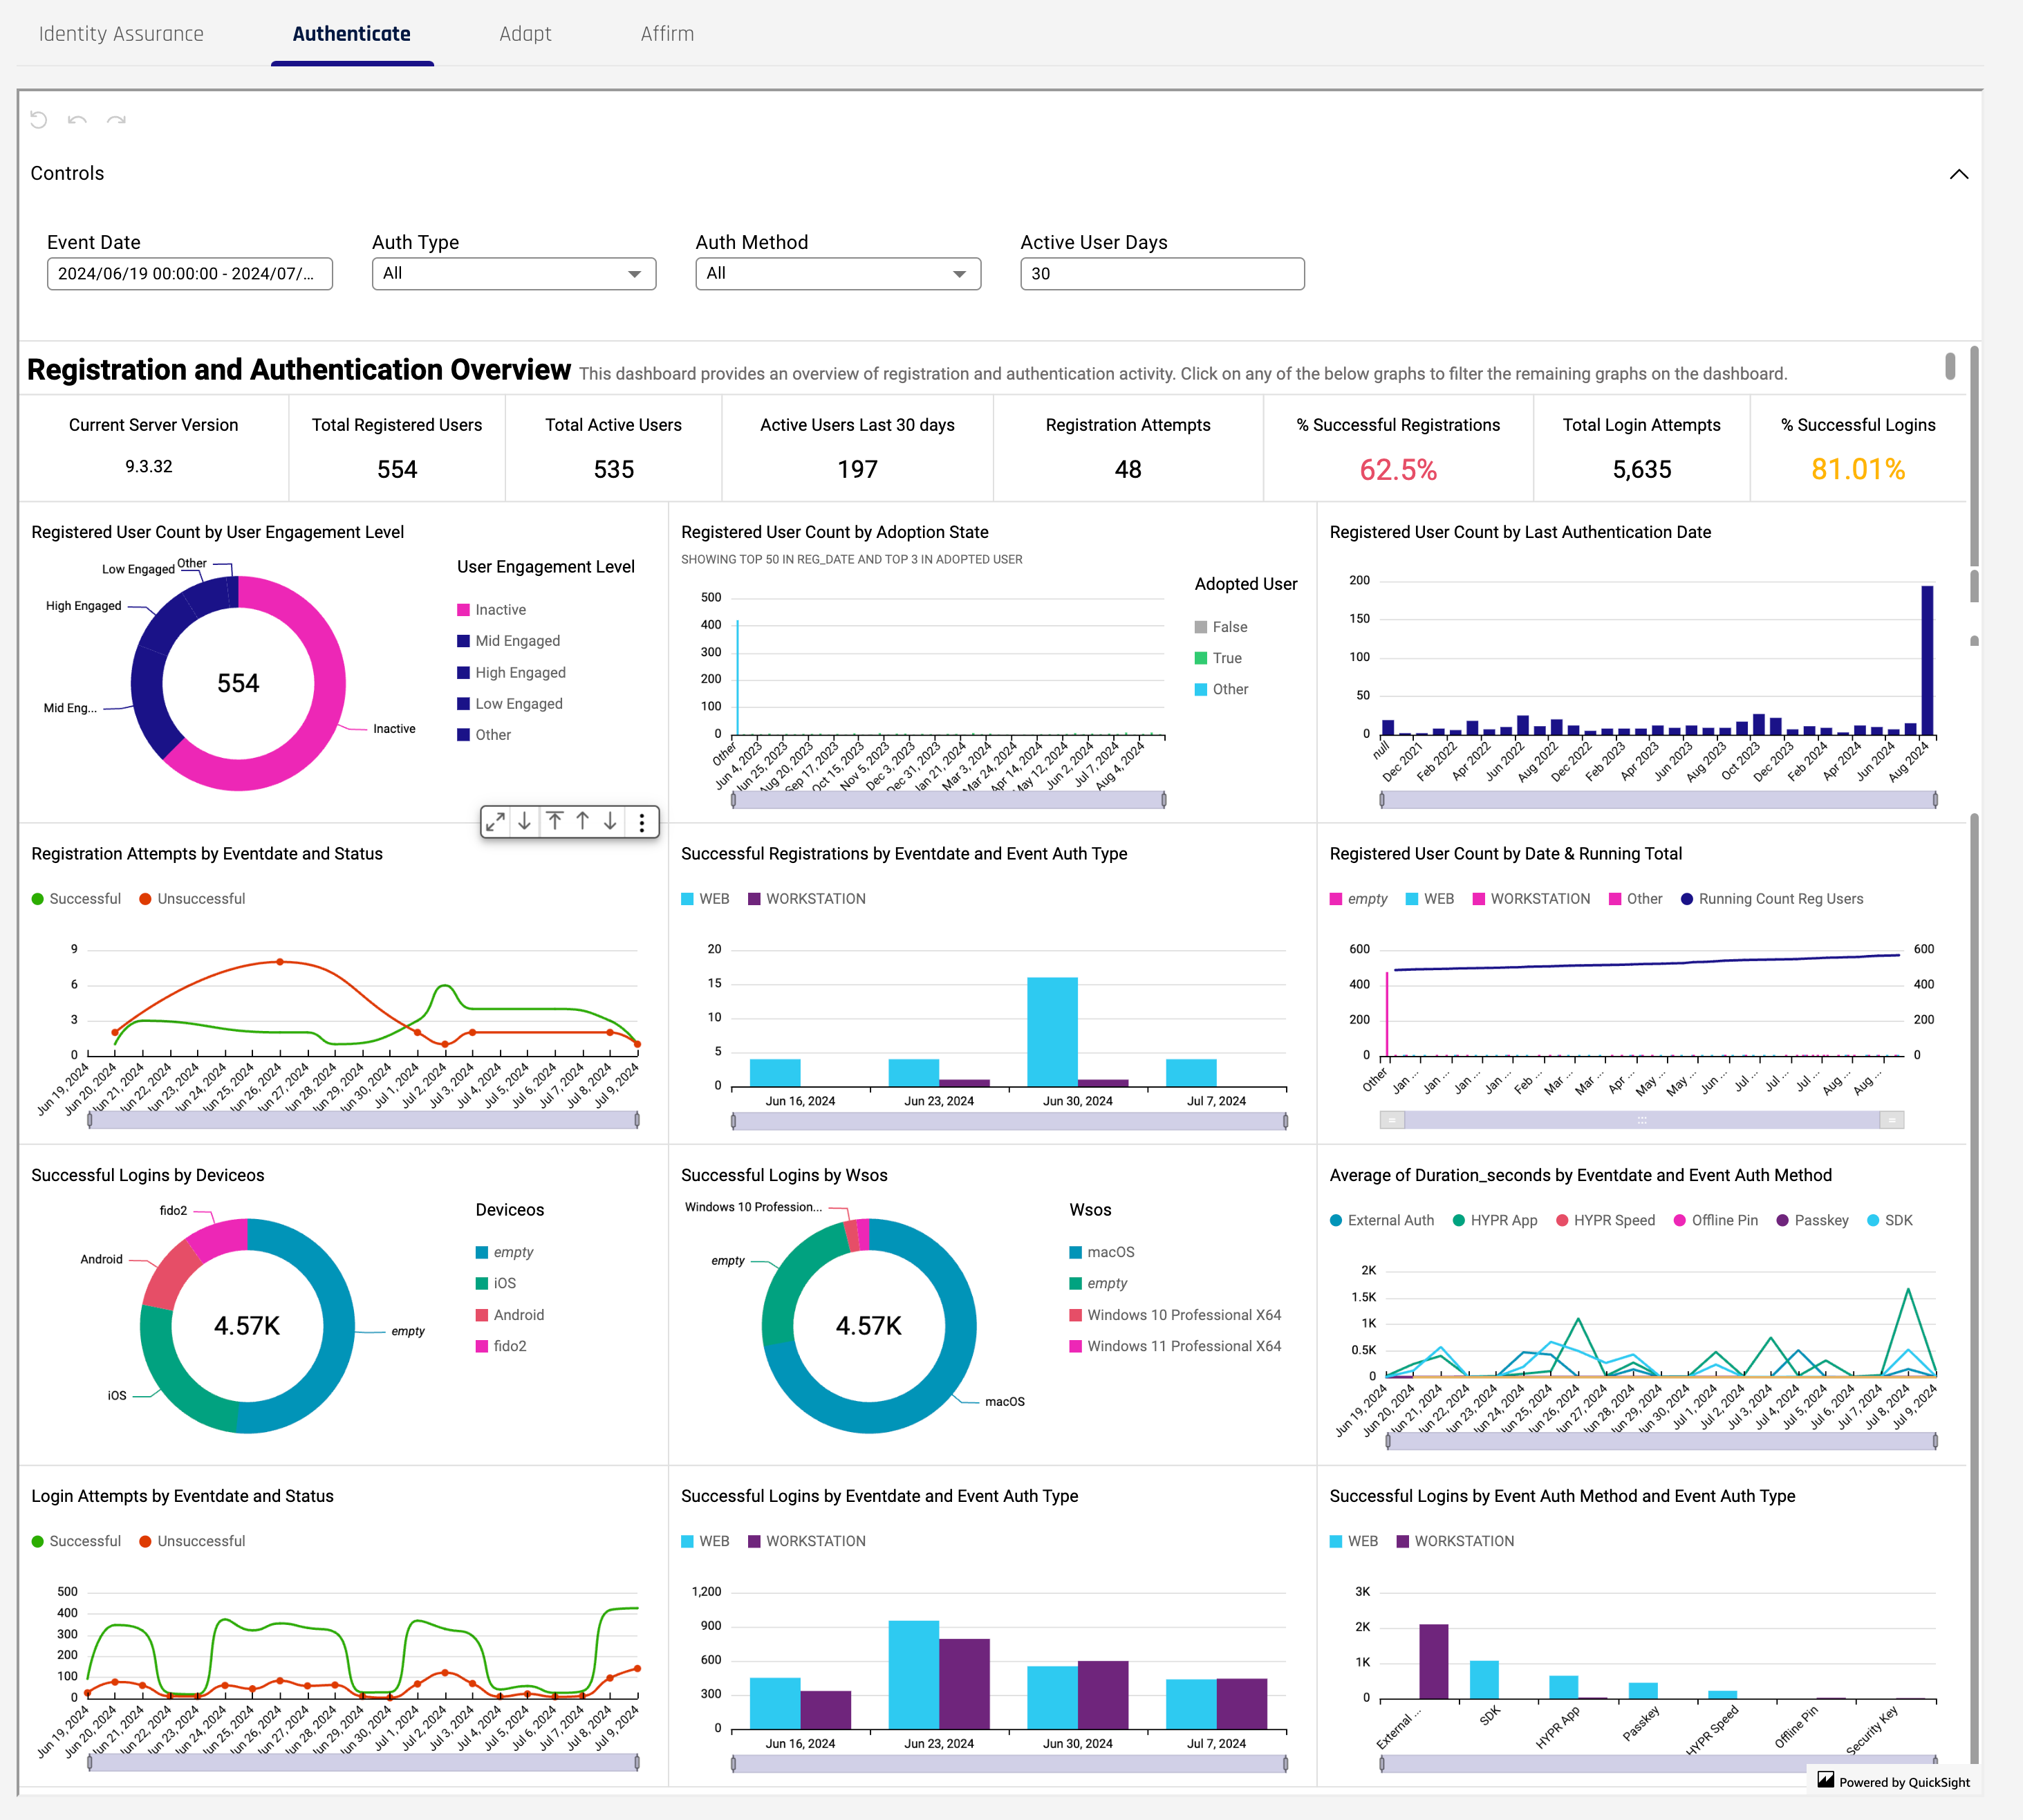
Only one Authenticate Dashboard is in use at this time.
Authenticate Dashboard Controls
-
Event Date: Opens the QuickSight dialog to set a range of dates
-
Auth Type: The HYPR method used to authenticate: Web | Workstation
-
Auth Method: The method used for authentication; External Auth | HYPR App | HYPRspeed | Offline PIN | Passkey | SDK | Security Key
-
Active User Days: The number of days in the past to count active users
Registration and Authentication Overview
-
Registered User Count by User Engagement Level: Filter by Level: Inactive | Low Engaged | _Mid Engaged | High Engaged | Other
-
Registered User Count by Adoption Status: Filter on user adoption: True | False | Other
-
Registered User Count by Last Authentication Date
-
Registration Attempts by Eventdate and Status: Filter on status: Successful | Unsuccessful
-
Successful Registrations by Eventdate and Event Auth Type: Filter by Auth type: WEB | WORKSTATION
-
Registered User Count by Date & Running Total: Filter by: WEB | WORKSTATION | empty | Other | Running Count Reg Users
-
Successful Logins by Deviceos: Filter on Deviceos: Android | empty | fido2 | iOS
-
Successful Logins by Wsos: Filter on Wsos (workstation OS): empty | macOS | Windows 10 Professional X64 | Windows 11 Professional X64
-
Average of Duration_seconds by Eventdate and Event Auth Method: Filter on Event Auth Method: External Auth | HYPR App | HYPRspeed | Offline PIN | Passkey | SDK | Security Key
-
Login Attempts by Eventdate and Status: Filter on Successful or Unsuccessful
-
Successful Logins by Eventdate and Event Auth Type: Filter on Event Auth Type: WEB | WORKSTATION
-
Successful Logins by Event Auth Method and Event Auth Type: Filter on Event Auth Type: WEB | WORKSTATION
Adapt Dashboards
The Adapt Dashboard opens by default to the Metrics tab.
The reports here are the same as in dashboard that appears in the HYPR Adapt Risk Reports tab.
Adapt Metrics Dashboard
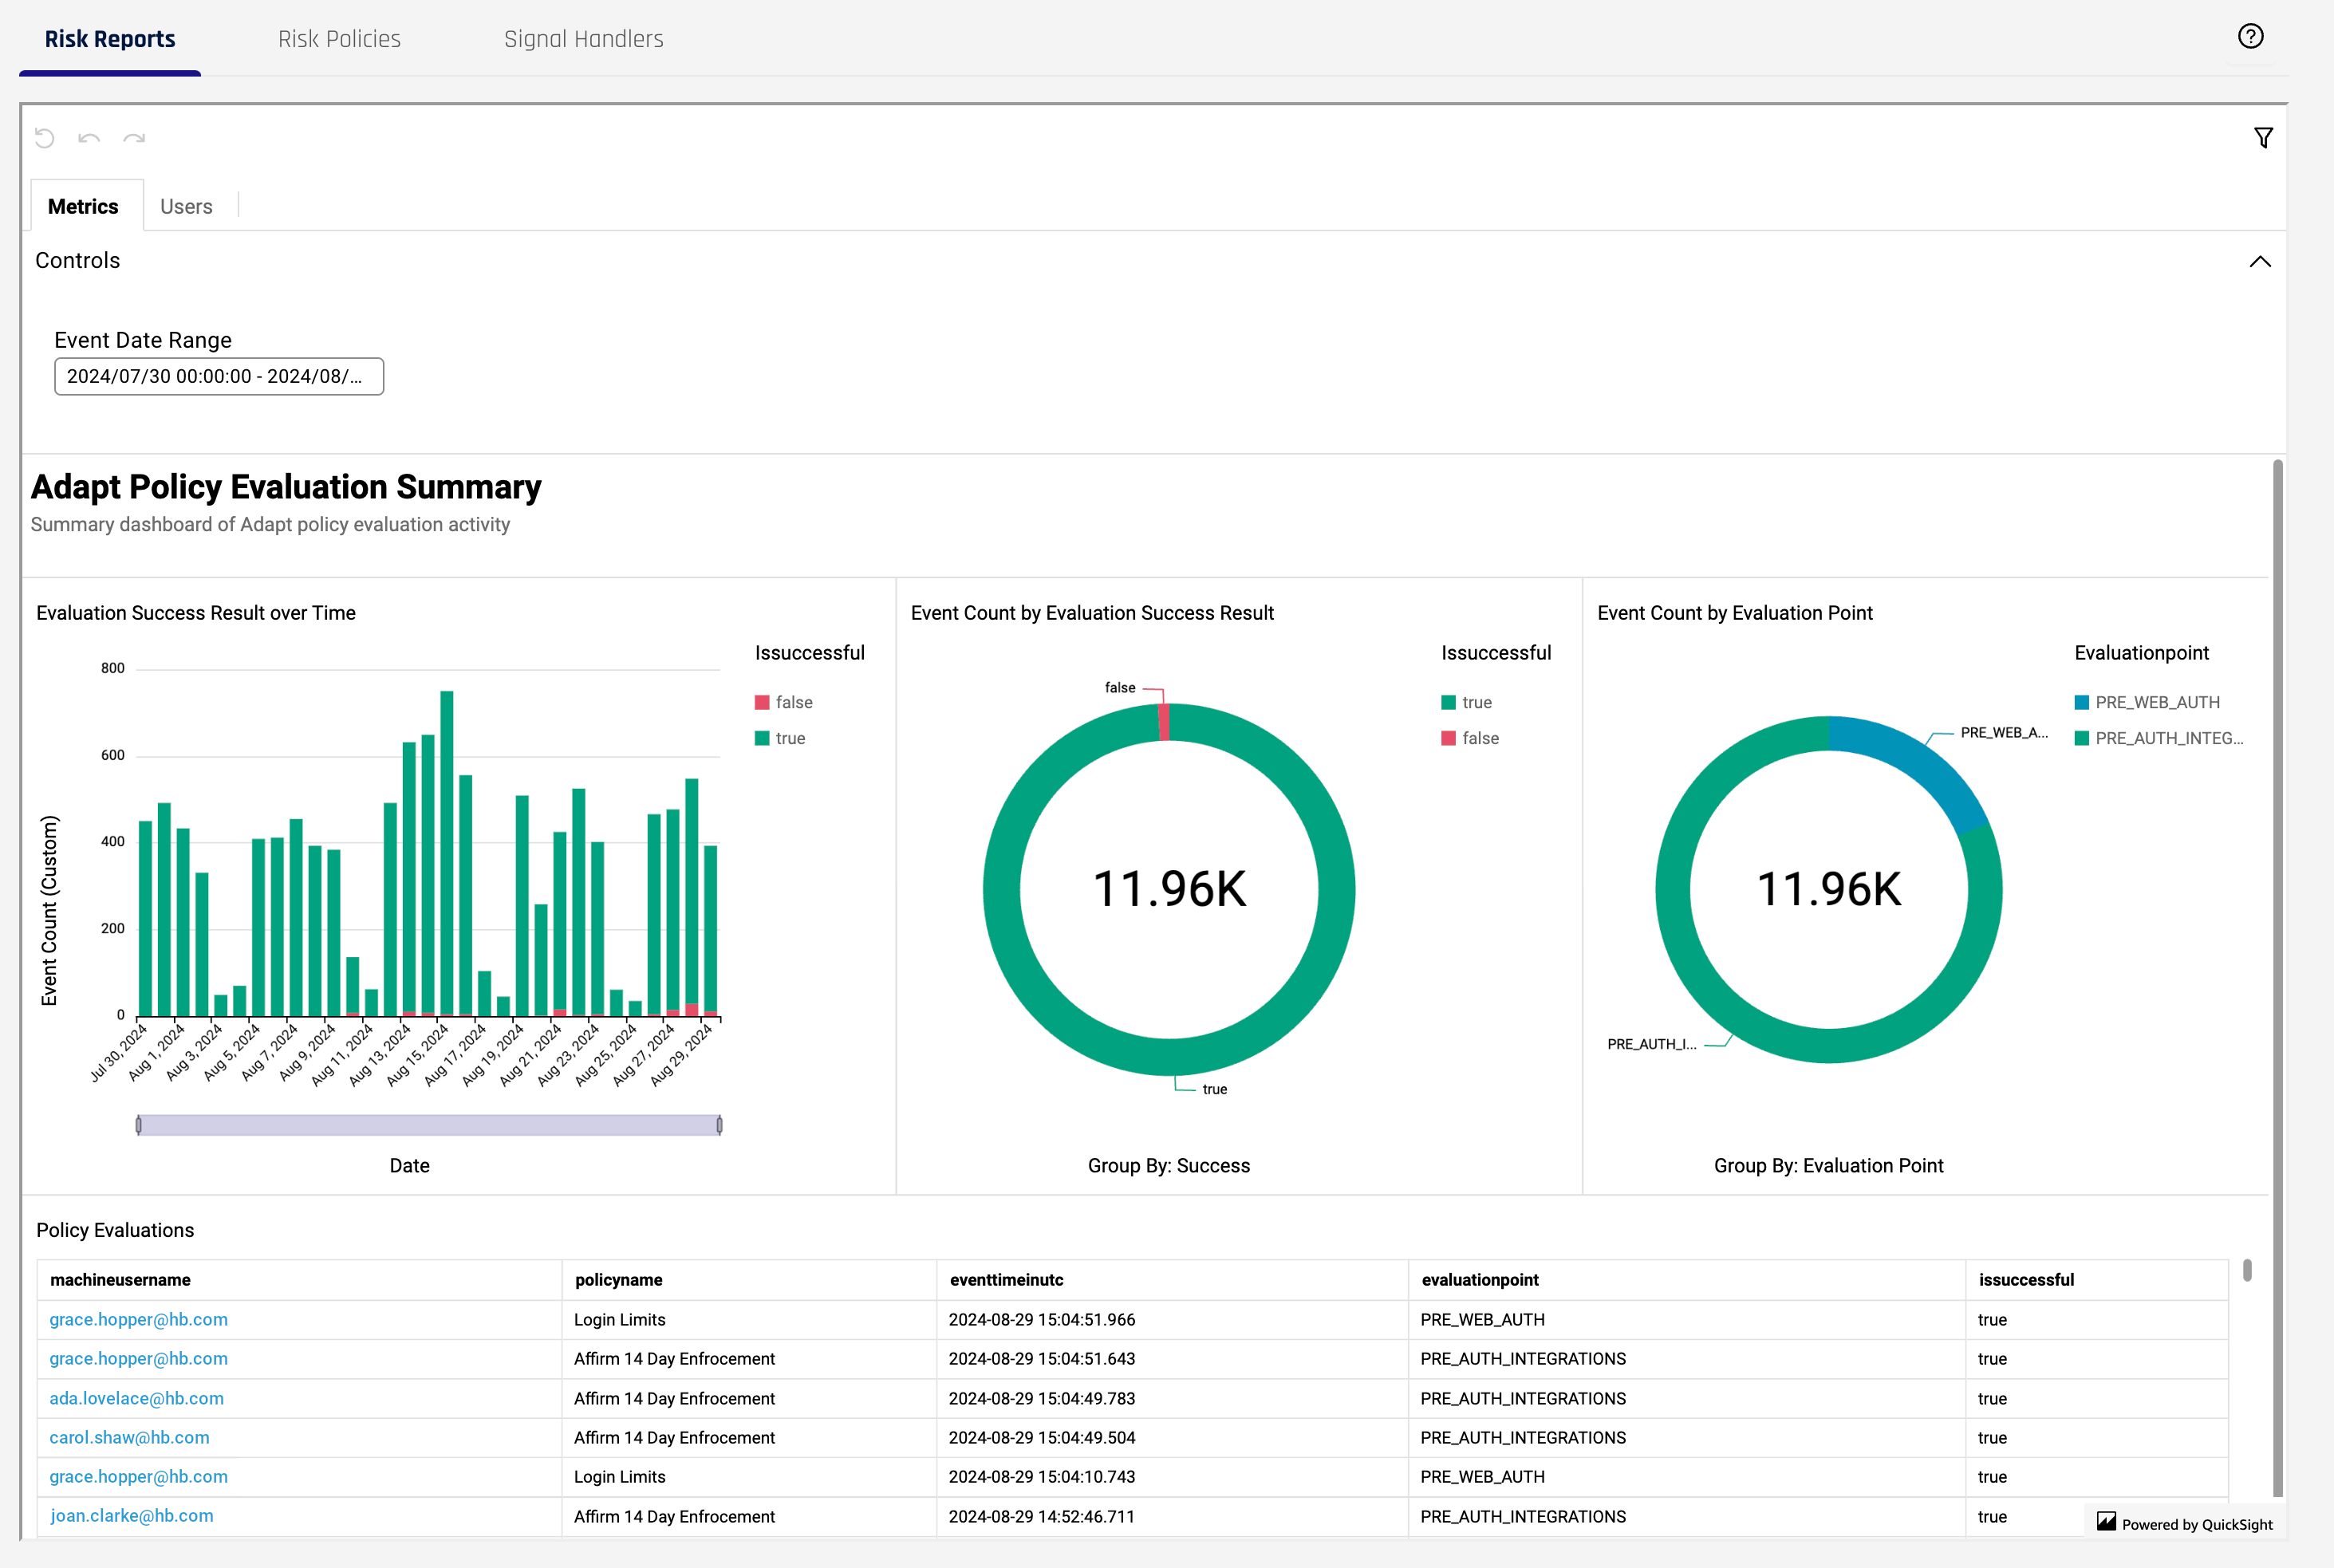
Adapt Metrics Dashboard Controls
- Event Date Range: Opens the QuickSight dialog to set a range of dates
Adapt Policy Evaluation Summary
-
Evaluation Success Result over Time: Filter on
isSuccessful: True | False -
Event Count by Evaluation Success Result: Filter on
isSuccessful: True | False -
Event Count Evaluation Point: The evaluation point at which the policy will be executed by Control Center (CC). Filter on one or more of the following values:
-
PRE_WEB_AUTH: For OOB/QR flows, this is invoked before the push message is sent, to block push bombing; for FIDO2, this is invoked on assertions/options, since there is no other pre-step for FIDO2 -
POST_WEB_AUTH: Occurs on/rp/api/oob/client/authentication/requests/{requestId}and request status ==COMPLETED -
PRE_FIDO_AUTH: Occurs onfido/get/auth -
POST_FIDO_AUTH: Occurs onfido/send/auth -
PRE_FIDO2_AUTH: Occurs onfido2/assertion/options -
POST_FIDO2_AUTHOccurs onfido2/assertion/result -
PRE_AUTH_INTEGRATIONS: Before integrations begin -
POST_AUTH_INTEGRATIONS: After integrations finishTrack the policy check before/after an auth request from a HYPR integration; for example:
Keycloak calls the PRE evaluation point before it displays the authentication options; these are special in that these are not invoked by CC directly - only when a policy evaluation is requested on these points via API. Note that in Keycloak, the POST evaluation point call is not implemented yet.
-
PRE_WORKSTATION_UNLOCK: On/client/authorize/unlock; the start of the workstation unlock request -
POST_WORKSTATION_UNLOCK: Onclient/authorization/complete/{sessionId}, the start of the workstation unlock request; OR onclient/verification/complete/{sessionId}, the start of the workstation unlock request
-
-
Policy Evaluations: A list of evaluation events including the following columns:
-
machineusername: The unique name of the machine's user account attempting authentication -
policyname: The human-readable name of the policy -
eventtimeinutc: The timestamp of the event in UTC Epoch time -
evaluationpoint: The evaluation point for the policy (see above for descriptions) -
issuccessful: Boolean value indicating success or failure; True | False
-
Adapt Users Dashboard
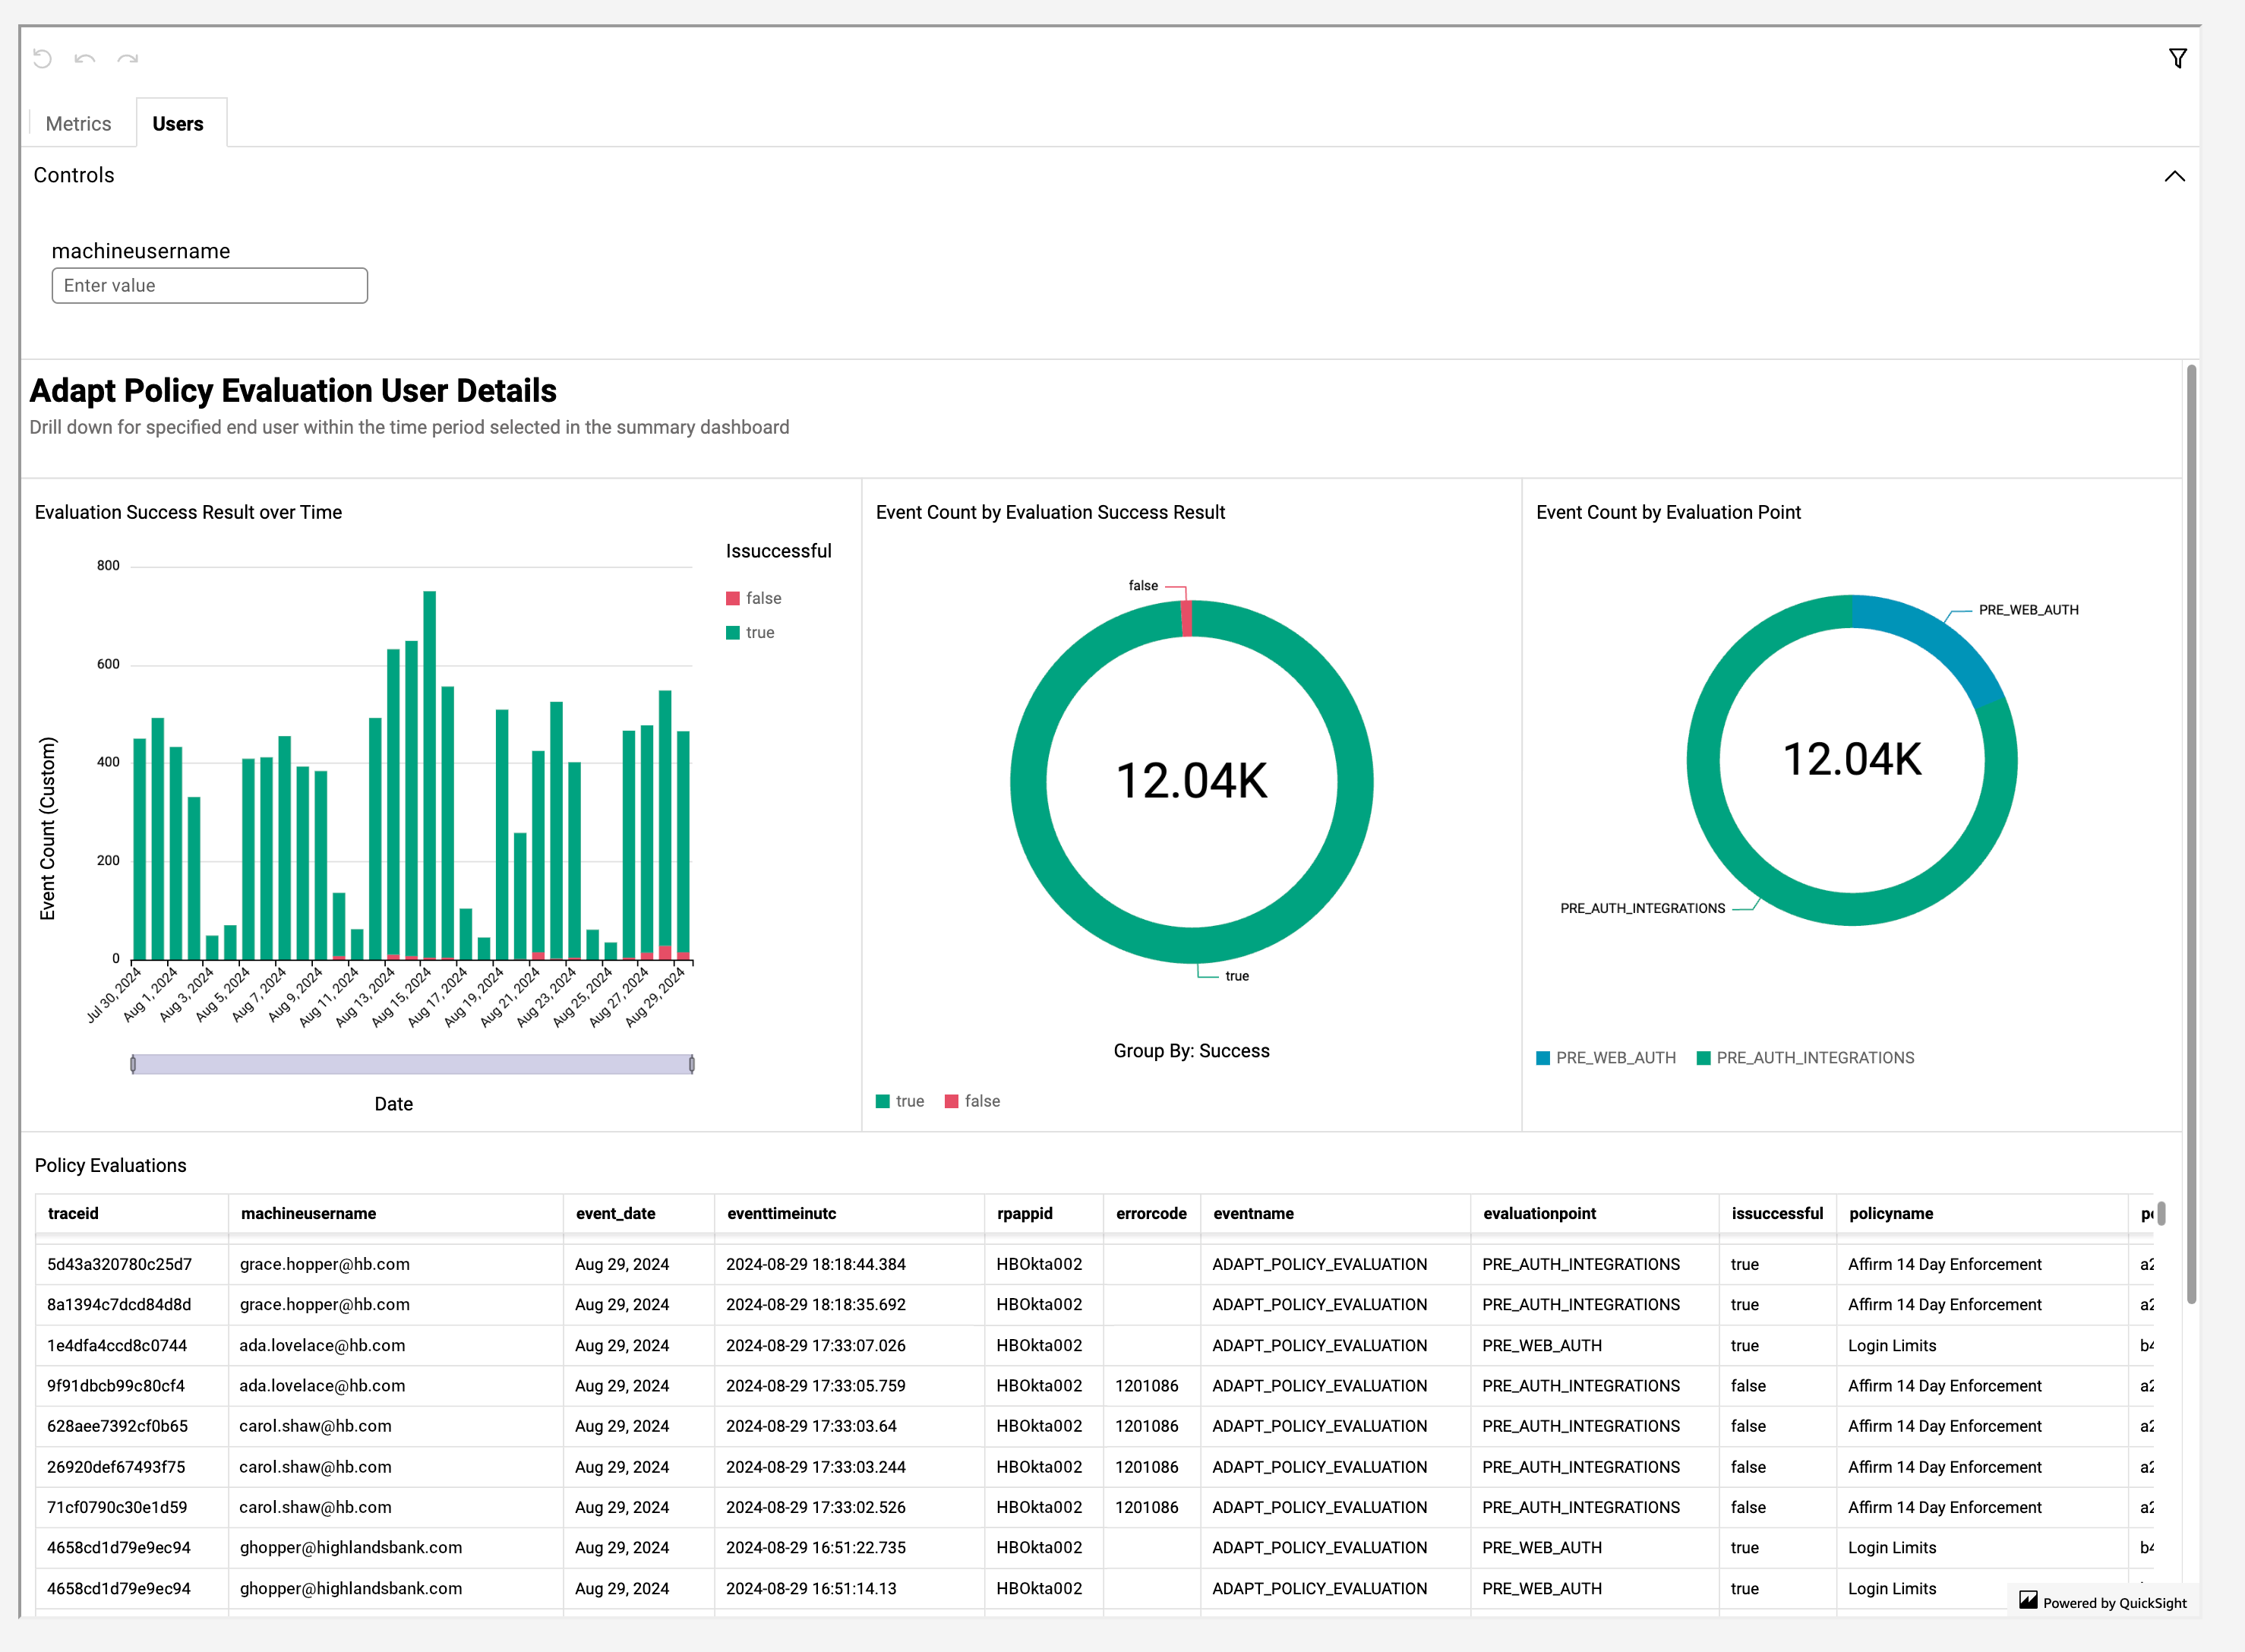
Adapt Users Dashboard Controls
machineusername: The unique name of the machine's user account attempting authentication
Adapt Policy Evaluation User Details
A more detailed view of individual policy events, including the same reports as shown in Adapt Policy Evaluation Summary. The Policy Evaluations report on the User tab contains all the fields shown in the Metrics tab's Adapt Policy Evaluation Summary, plus the following fields:
-
traceid: The unique HYPR trace identifier -
event_date: A human-readable date for the event -
rpappid: The camel-case unique identifier for the RP application -
errorcode: The HYPR error code, which is detailed in the Error Codes Tables -
eventname: The HYPR Event name -
policyid: The unique identifier for the policy
Affirm Dashboards
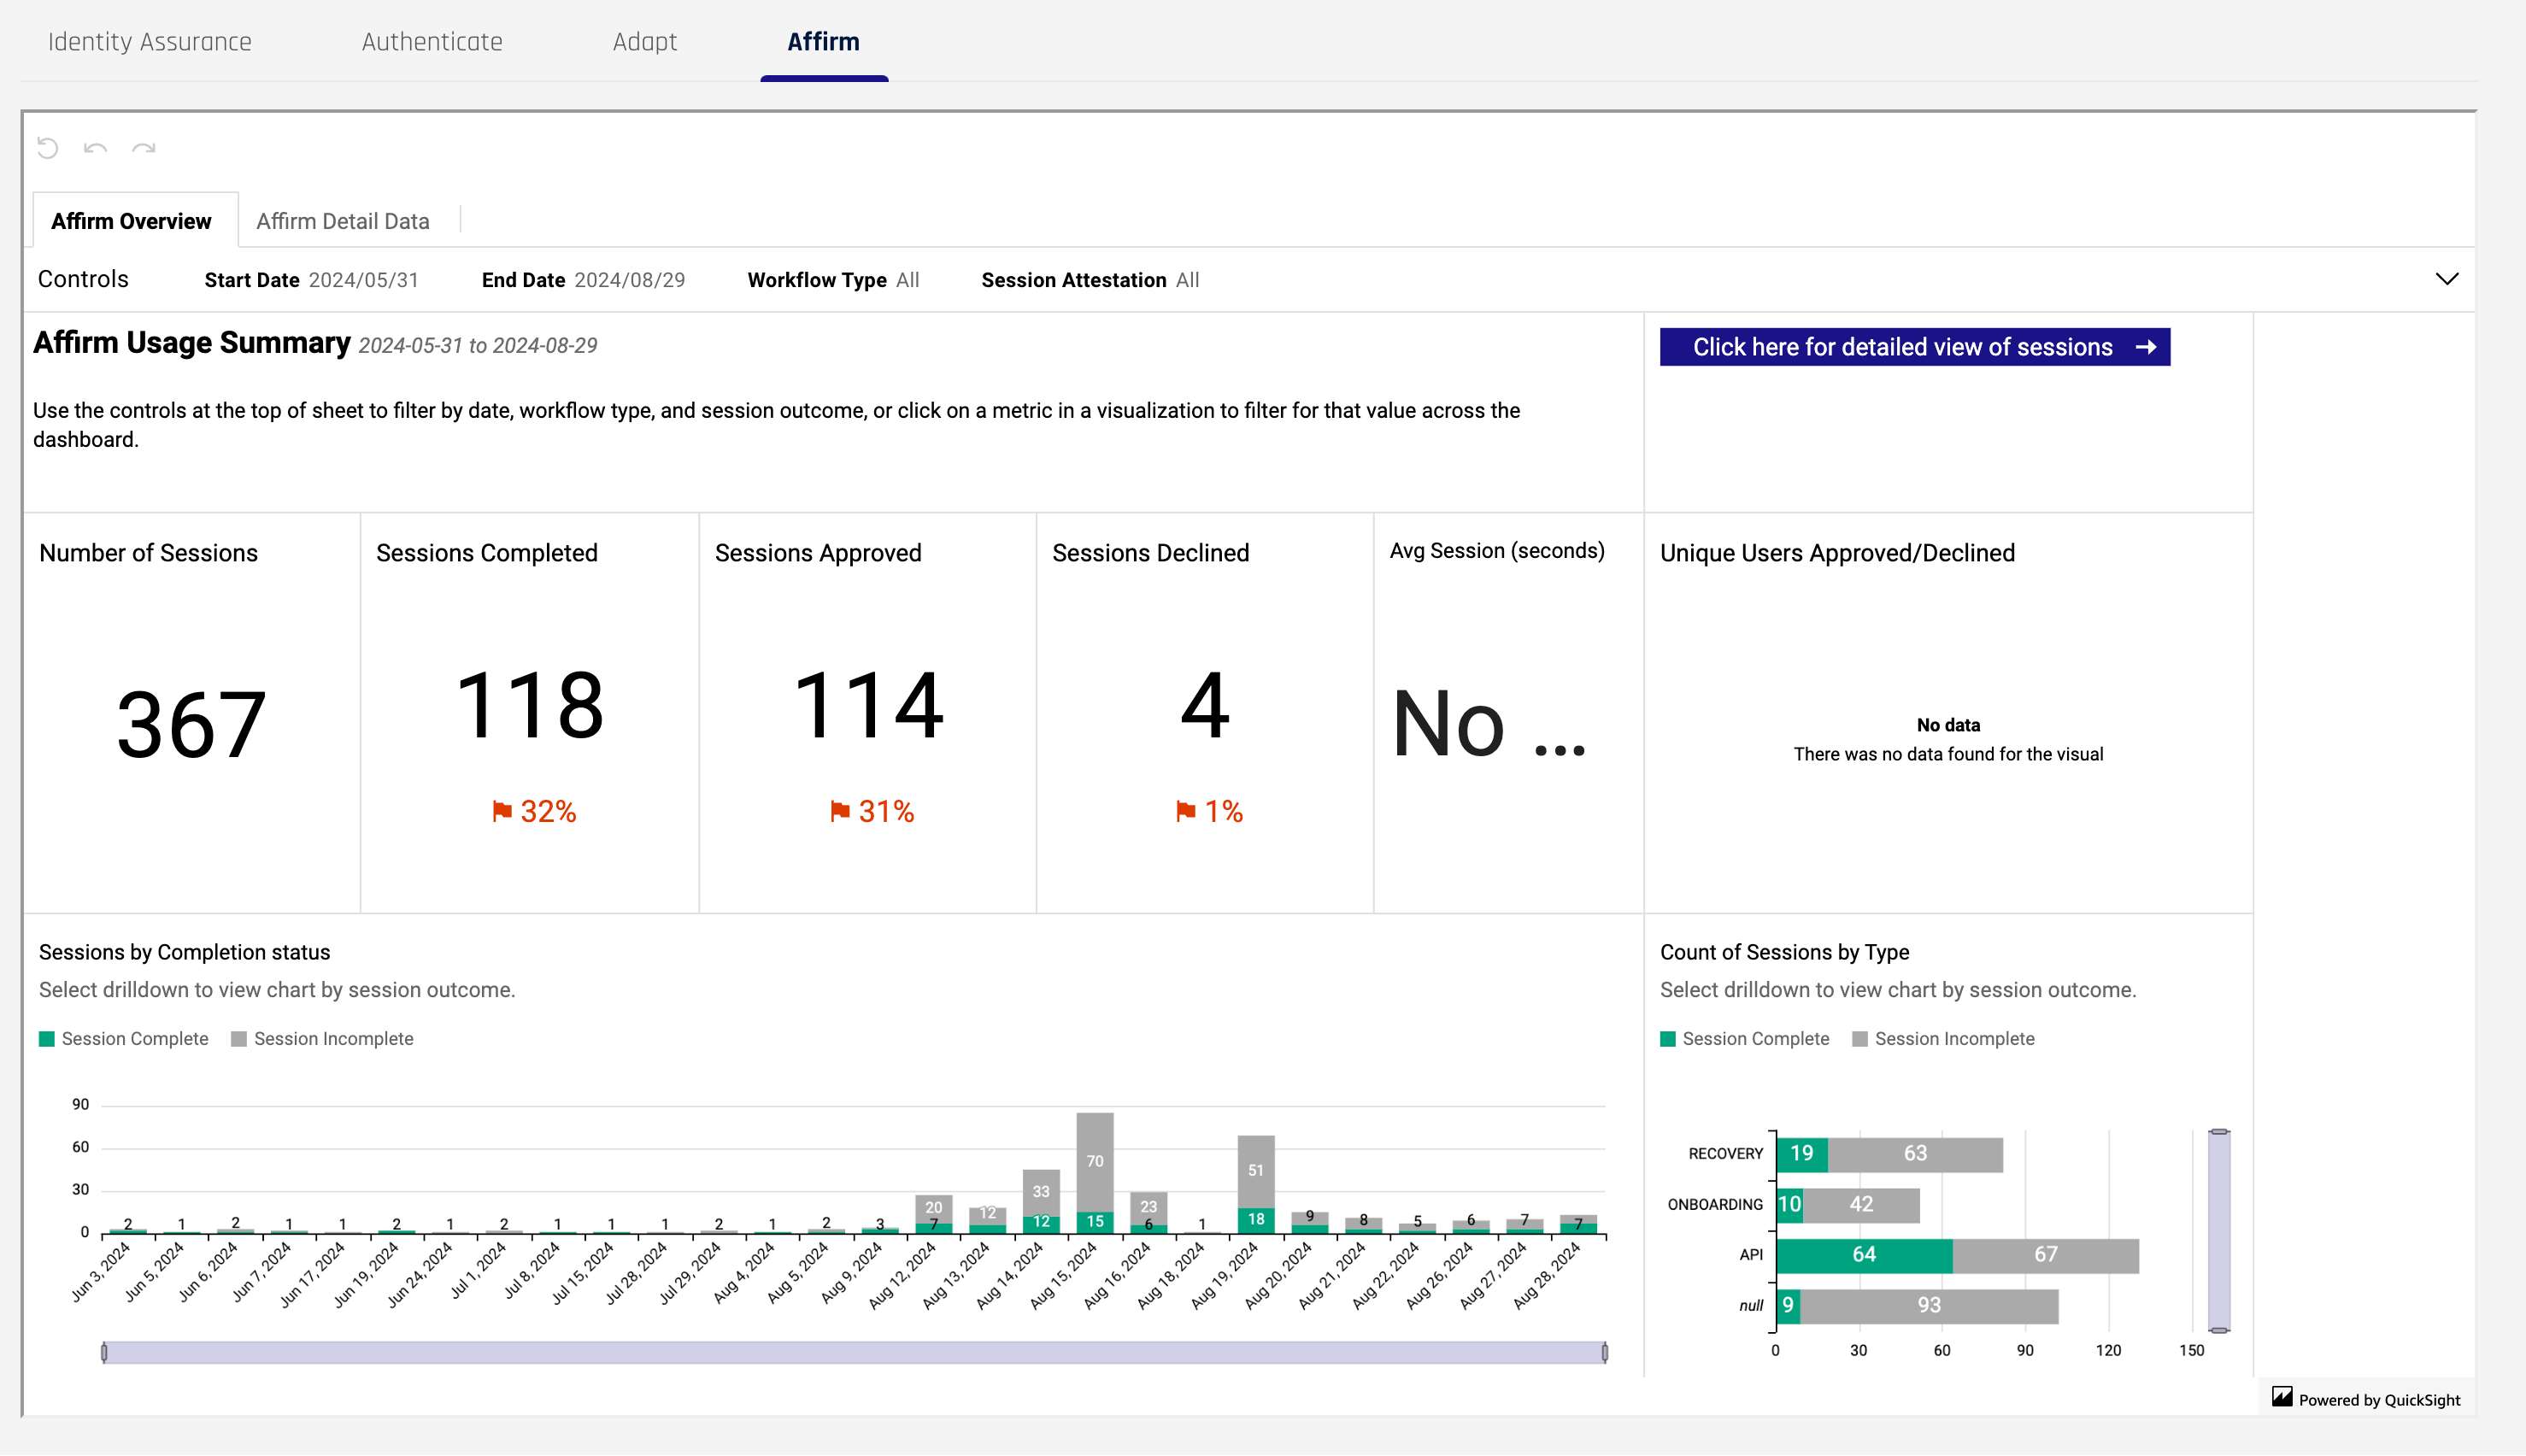
Affirm Overview Dashboard
Affirm Overview Dashboard Controls
-
Start Date: The beginning of the window of time in which to report
-
End Date: The end of the window of time in which to report
-
Workflow Type: Which flow is the requester using? ONBOARDING | RECOVERY | API | null
-
Session Attestation: The outcome of the session: Complete | Incomplete
Affirm Usage Summary
-
Number of Sessions: Total number of sessions within the specified window of time
-
Sessions Completed: Total number of completed sessions within the specified window of time
-
Sessions Approved: Total number of approved sessions within the specified window of time
-
Sessions Declined: Total number of declined sessions within the specified window of time
-
Avg Session (seconds): Average time in seconds of all sessions within the specified window of time
-
Unique Users Approved/Declined: Filter on approval status: Approved | Declined
-
Sessions by Completion Status: Filter on completion status: Session Complete | Session Incomplete
-
Count of Sessions by Type: Drill down after making a selection and/or filter on completion status: Session Complete | Session Incomplete
Affirm Detail Data Dashboard
Affirm Detail Data Dashboard Controls
Controls here contain all the attributes described in the Affirm Overview Dashboard Controls, plus the following:
-
Session Attestation Status: The outcome of the session: Complete | Incomplete
-
User Role: Is the user a Requester or an Approver?
-
WorkflowID: The unique identifier for the workflow, assigned by HYPR
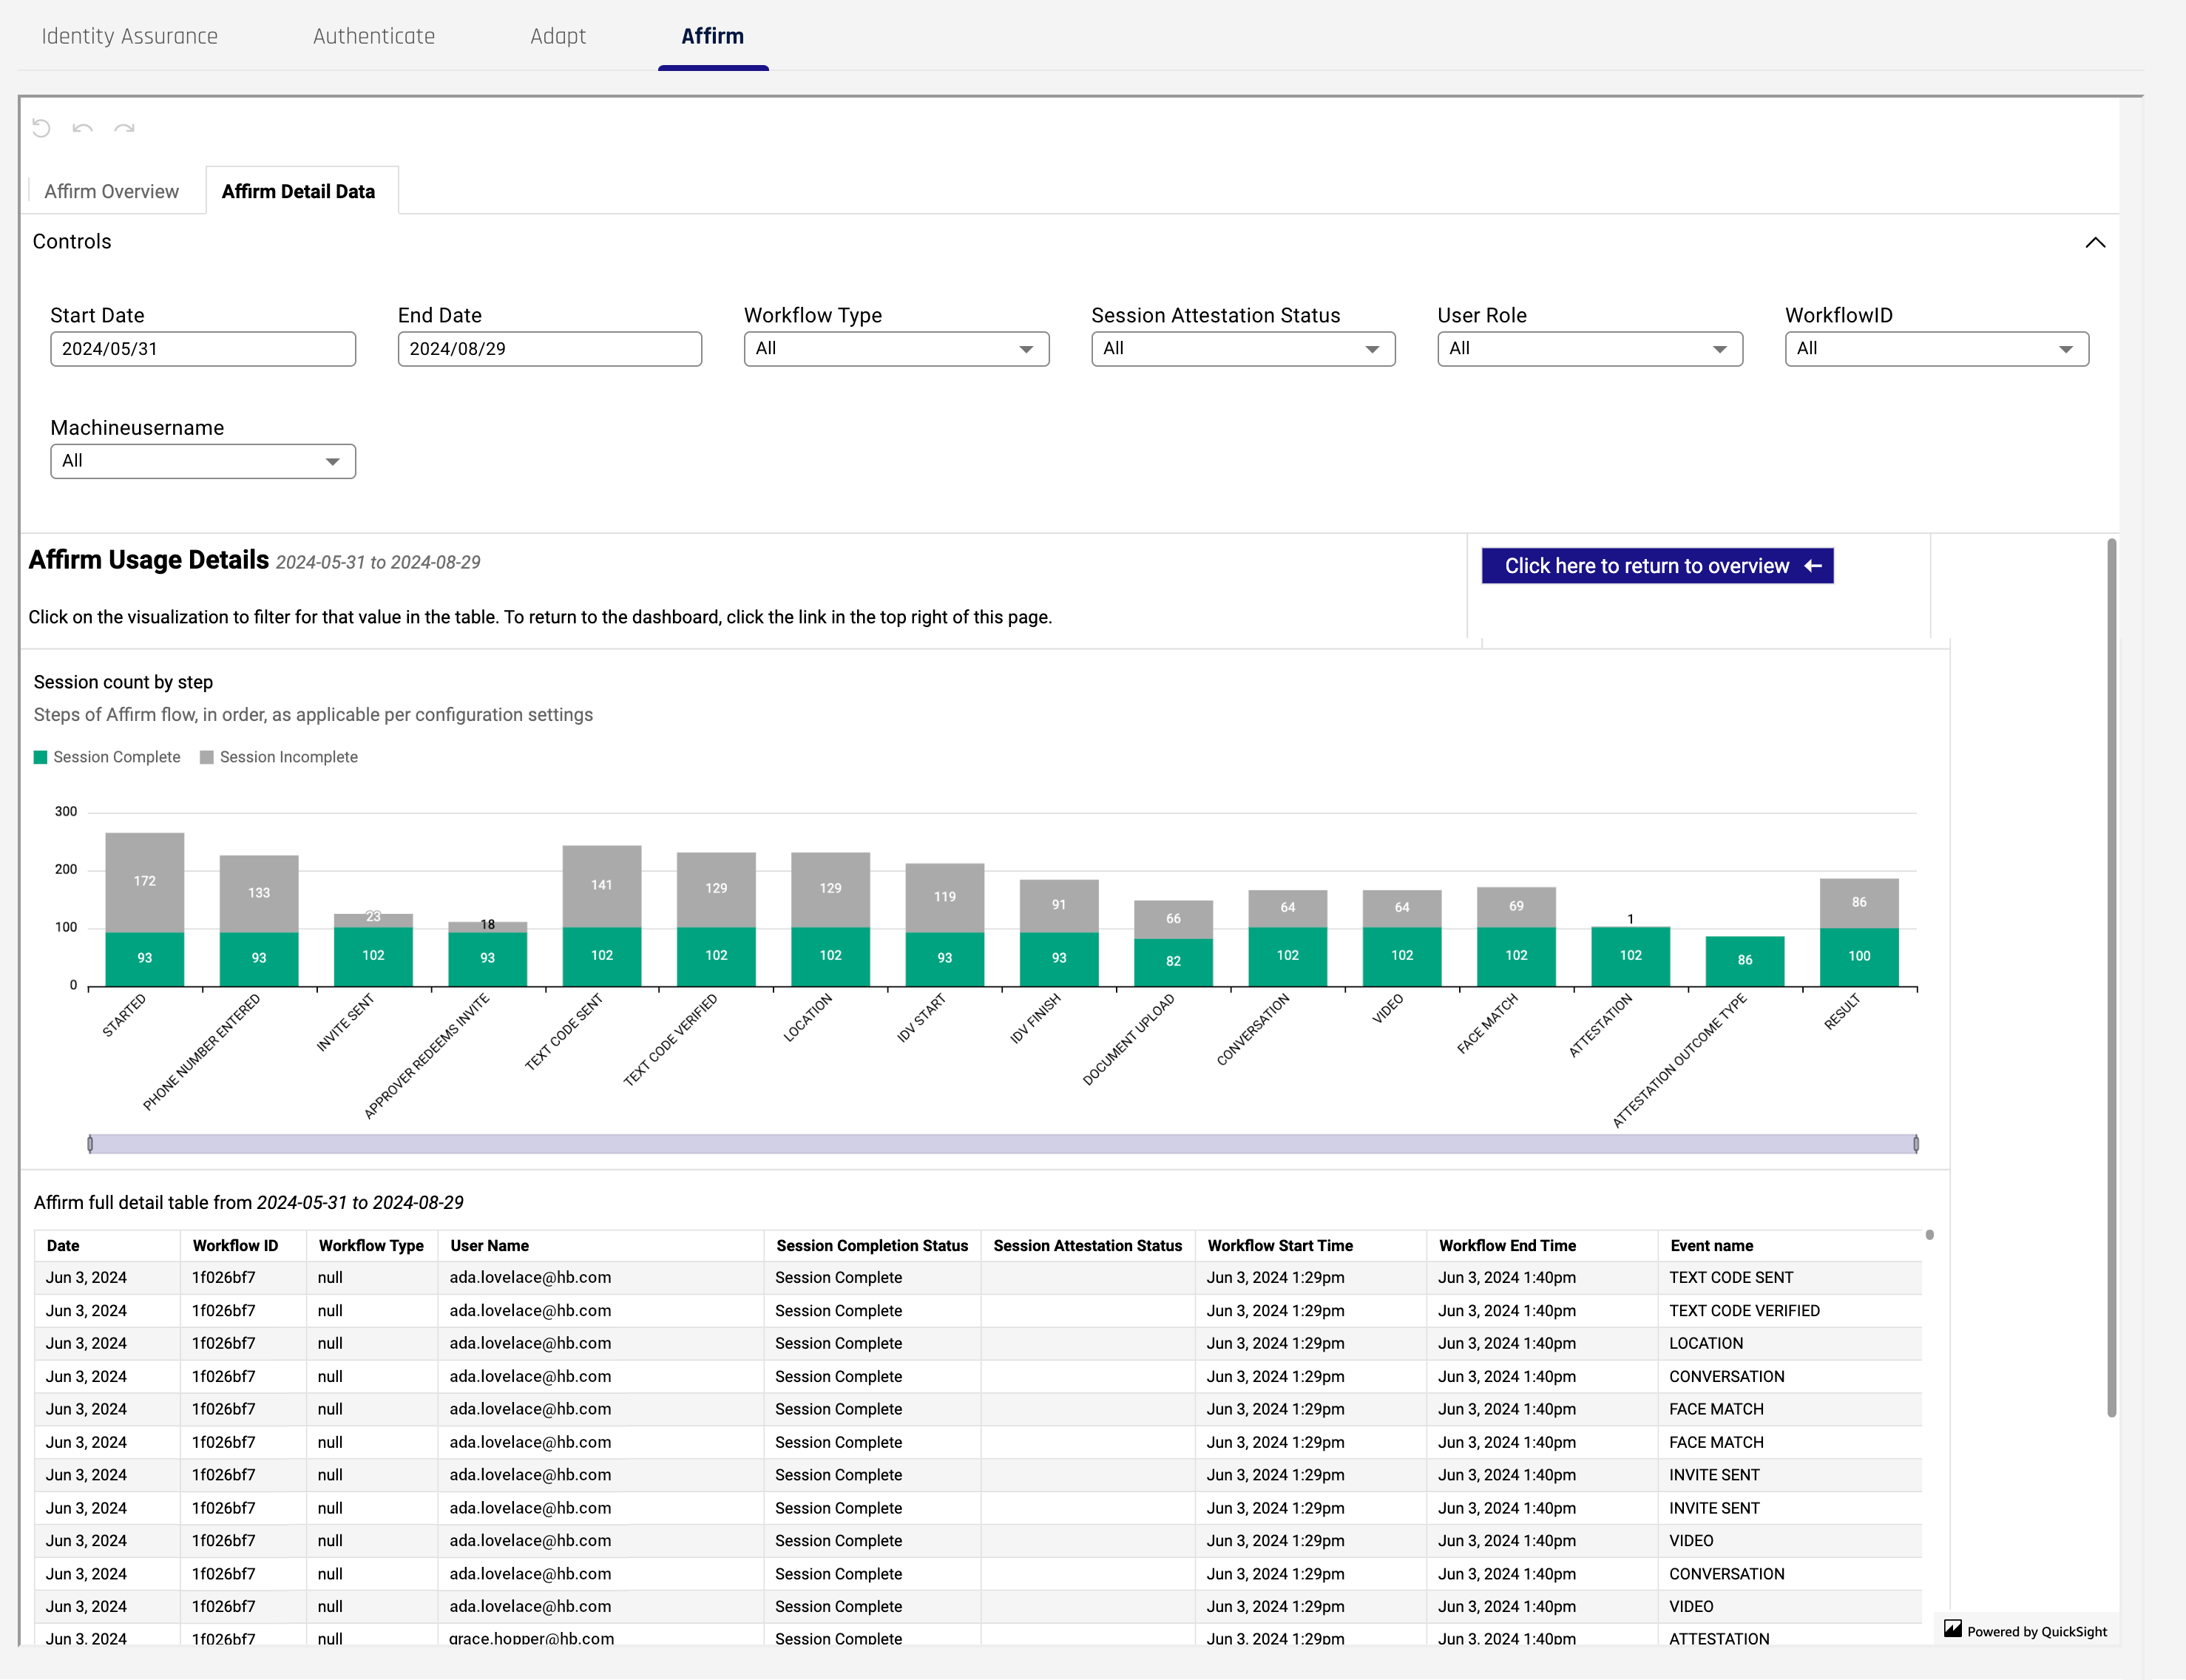
Affirm Usage Details
-
Session count by step: Steps in the Affirm IdV flow, in order or occurrence, counting complete and incimplete sessions for each step along the way. Filter on completion status: Session Complete | Session Incomplete
-
_Affirm full detail table from [Start Date] to [End Date], including the following fields:
-
Date: A human-readable date when the event occurred
-
Workflow ID: The unique identifier for the workflow within which the event occurred
-
Workflow Type: Which flow is the requester using? ONBOARDING | RECOVERY | API | null
-
User Name: The user; either the requester or the approver
-
Session Complete Status: Analagous to the Session Attestation Status (q.v.)
-
Session Attestation Status: The outcome of the session: Complete | Incomplete
-
Workflow Start Time: A human-readable timestamp for when the event started
-
Workflow End Time: A human-readable timestamp for when the event ended
-
Event name: The HYPR Event(s) associated with the authentication attempt; See Event Descriptions for a full description of HYPR Events.
-