Signal Handler Management
This article is subject to change as the feature develops and we make improvements.
The calls to perform CRUD operations and to test HYPR Adapt Signal Handlers can be found under Control Center > Adapt > Event (Signal) Handlers in the HYPR Passwordless API collection.
Get more out of HYPR Signals by adding functionality using Signal Handlers. Handlers come in three types, each of which provides customizeable augmentation to existing signals.
-
Action Executor - Performs additional actions when the specified event or signal occurs
-
Data Collector - Collects and stores data points relevant to signals and events at a scheduled interval
-
Signal Enricher - Includes additional information along with the signal
Additionally, you can write your own custom Handlers to meet your needs. Use HYPR Adapt's provided templates to get started, then configure and test your handler to perfect your code before letting it loose in the wild.
Signal Handlers appear only in Standard Mode: HYPR Adapt.
Overview
The main pane of the Signal Handlers tab will display the + Signal Handler button to the right of the search field, some Signal Handler metrics and then a table listing all the Signal Handlers (an empty box will show instead if you have no Signal Handlers).

Metrics Overview
Easily analyze how Adapt is ingesting and handling the signals from your tenant.
Set the time period that's covered by the Metrics Overview using the Show Metrics Within selection field at the top right of the page. Options include the following:
- 24 Hours
- 1 Week
- 30 Days
- 90 Days
- 180 Days
- 1 Year
The main pane of the_Metrics Overview_ section provides the following information:
-
Total Signals Received: A tally of all the signals that have been sent and ingested by Adapt within a certain timeframe. This will include signals that do not trigger any Signal Handler in a pipeline. Use this metric to confirm that Adapt is actively ingesting your signals.
-
Successes vs. Failures: The number of times a signal was able to successfully get processed through the Signal Handler pipeline (Successes) versues the number of times a signal was not able to successfully get processed through the pipeline (Failures). This value is represented in the chart by both count and percentage of total signals received. Successes are marked in blue and Failures are marked in red. This metric is useful to catch any sudden uptick in execution failures by a Signal Handler.
-
Most Ingested Signals: The top five signals that have been received and ingested by Adapt from your tenant by count. The chart provides the number of times each signal was ingested by Adapt during the selected timeframe. Use this metric to confirm that certain signals are being sent to Adapt at an expected frequency.
Signal Handlers Table
The information in the columns is as follows:
-
Name: The name of the Signal Handler
-
Description: The description of what the Signal Handler does
-
Executions (24 Hrs): The number of times the Signal Handler was invoked in the last 24 hours
-
Priority: The order of when the handler should run (Signal Handlers with a lower priority number will run first)
-
Date Created: The date the Signal Handler was created
-
Last Modified: The date the Signal Handler was last changed
-
Created By: The username who created the Signal Handler
-
Status: A badge indicating if the Signal Handler is active or inactive
Adding a Signal Handler
-
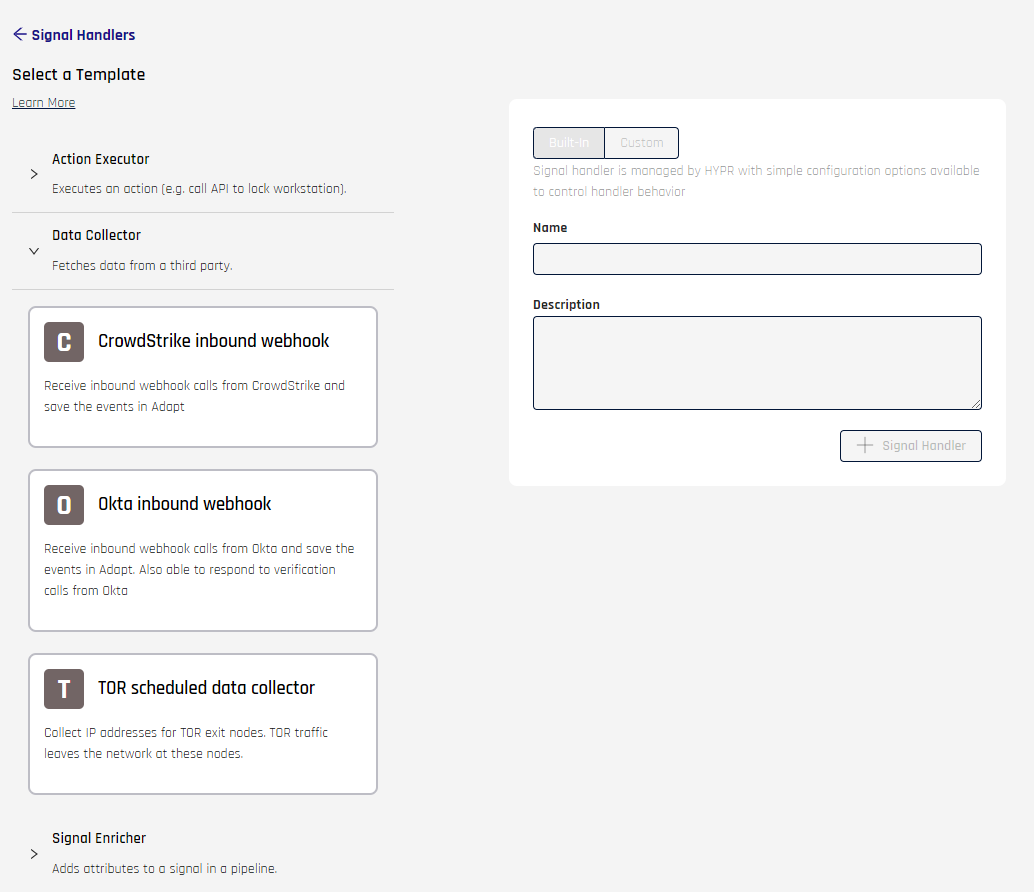
Click + Signal Handler in the upper right of the main pane. This will take you to the Select a Template page.
-
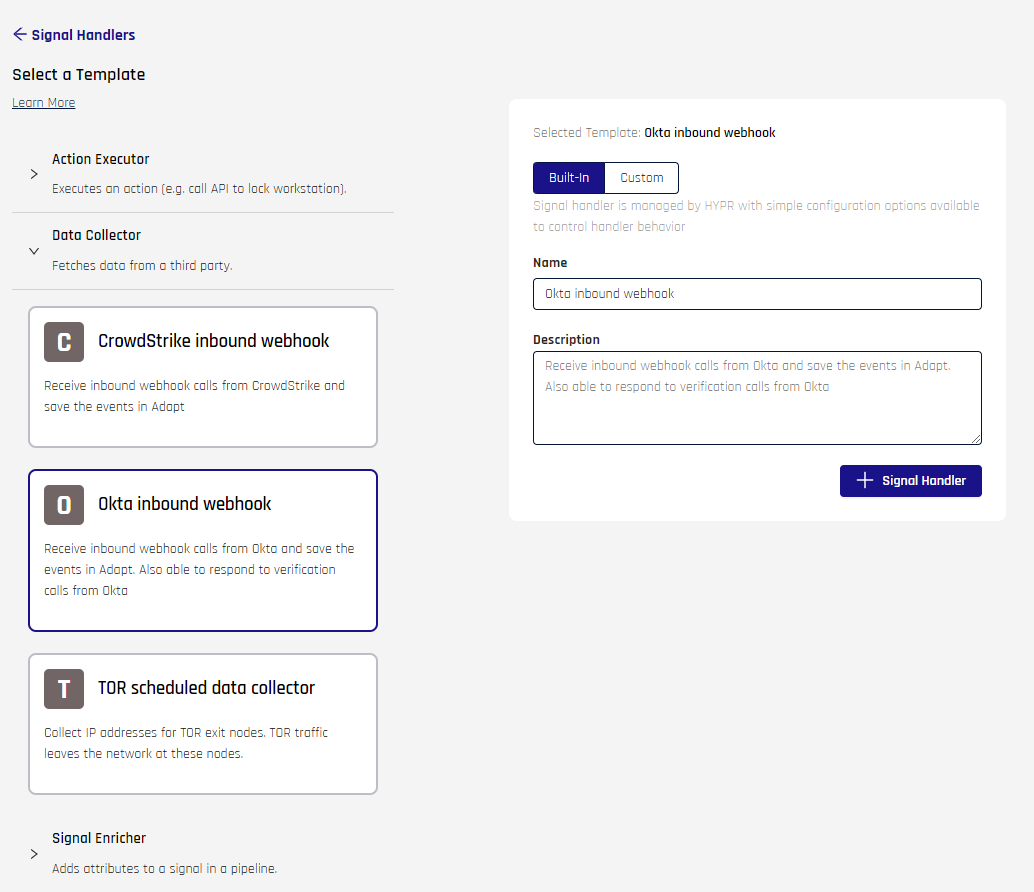
Expand the lists (Action Executor, Data Collector, or Signal Enricher) and select a Signal Handler template from the template list on the left side of the page. This will enable the creation form.
-
In the form select the Content Type:
- Built-In: A built-in Signal Handler will work as defined from the template but may allow configuration options to be set to modify its behavior.
- Custom: A custom Signal Handler will allow you to modify the underlying code and configuration options for the Signal Handler
-
Set the Name and Description (optional) for your Signal Handler then click + Signal Handler.
-
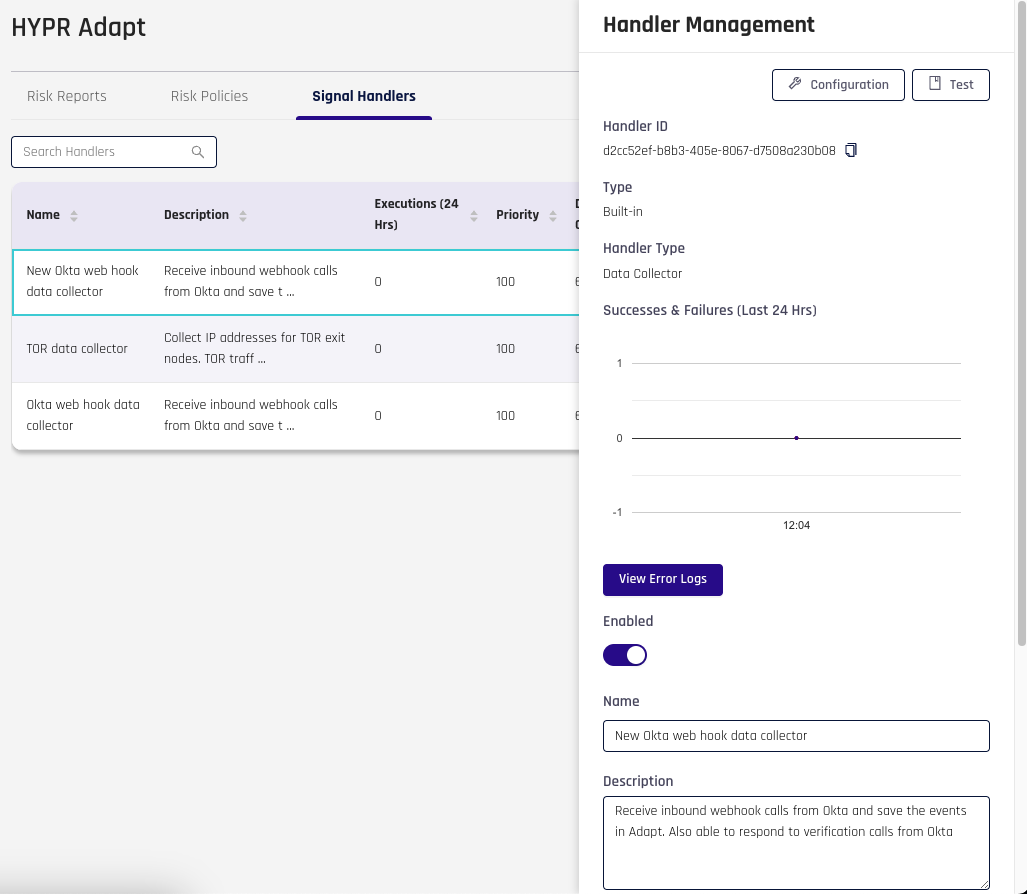
You will then be taken back to the Signal Handlers tab in the main Adapt Pane with your new Signal Handler automatically selected.
Managing a Signal Handler
To view or edit a Signal Handler, select the Signal Handler from the table. This will open the Handler Management drawer from the right side of the screen.

Click Configuration to open the handler configuration pane; click Test to open a test page for this handler.
The following static fields appear at the top of the pane:
- Handler ID: The unique identifier for the handler, copiable by using the icon to the right of the entry
- Type: Built-in | Custom (as chosen at handler creation)
- Handler Type: Action Executor, Data Collector, or Signal Enricher (as chosen at handler creation)
- Successes & Failures (Last 24 hours): A line graph showing successes (above the line) and failures (below the line) for the past day
The View Error Logs button will open the Test page's Error Logs tab.
The following editable fields appear towards the bottom of the pane:
- Enabled: Enables/Disables the Signal Handler
- Name: Set the name for the Signal Handler
- Description: Set the description for the Signal Handler
- Schedule: Set a schedule for this Signal Handler using this cron expressions reference. Only the values inside the parentheses in
cron()are needed. The Schedule field is only available for Data Collector Signal Handlers. - Execution Priority: Set the Execution Priority to determine the Order of this Signal Handler, as shown on the main list. Type a value from 0 to 10000. Default value is 100.
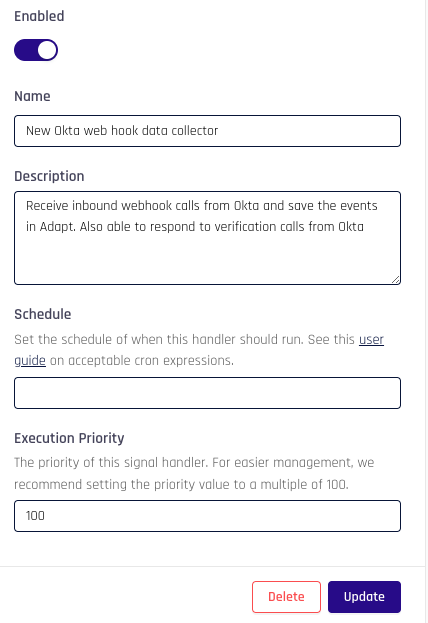
Click Update when you have finished making changes to these fields.
If you would like to delete the handler, click Delete.
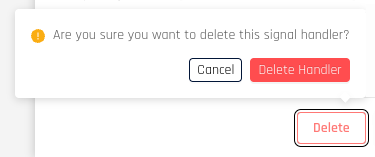
Click Delete Handler to confirm the action and the page will refresh with the handler removed.
Configuration
To view any Signal Handler configuration or edit a Custom Signal Handler's configuration, click the Configuration button at the top of the drawer pane:

This will take you to the Configuration tab pane in the Signal Handler's details page.
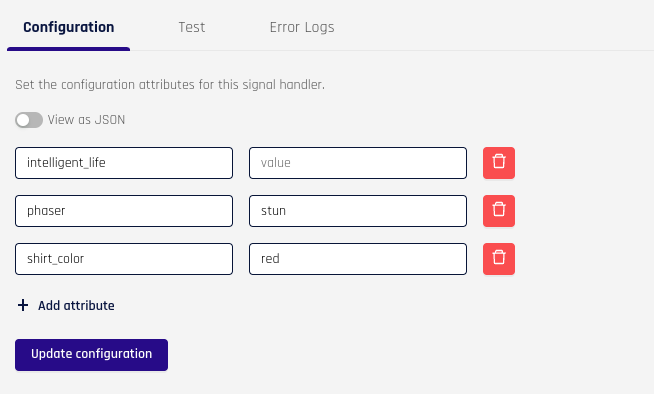
The configuration options for a signal handler will differ based on the template the handler was created from. See Signal Handler Templates for the list of available built-in handler templates and their configuration options.
You can set the configuration attributes in two ways.
-
Click + Add Attribute and type the values into the fields that appear.
-
Toggle View as JSON and add entries manually.
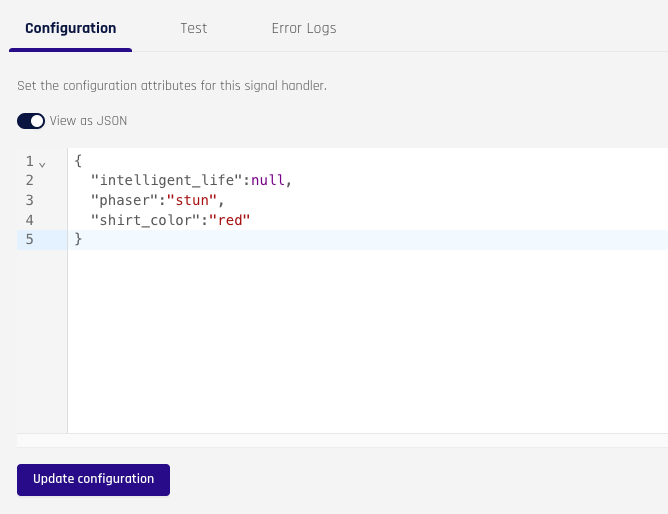
Click Update configuration when finished.
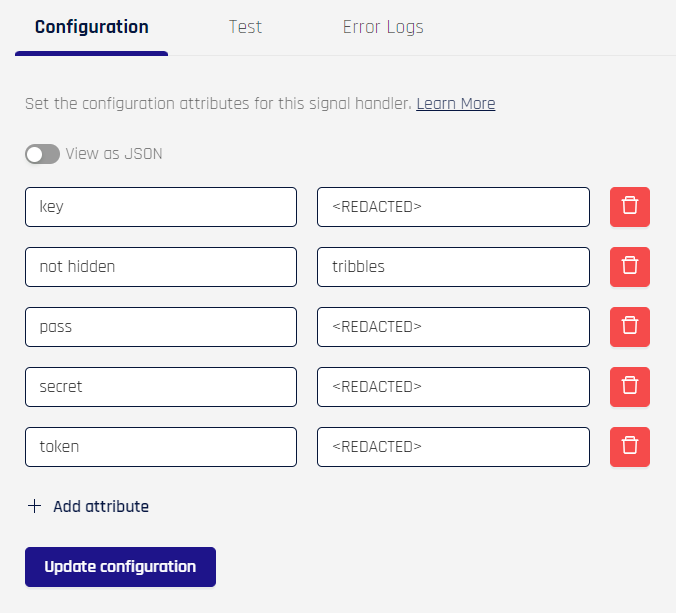
For security reasons, when clicking Update Configuration on the signal handler's Configuration tab, if a key name contains the strings, key, secret, or token, or if it starts with pass, Adapt will thereafter display <REDACTED> in the value contents, obscuring the actual value.
Actual values will still be available to the Signal Handler.
Test
To test any Signal Handler or edit a Custom Signal Handler's source code, click the Test button at the top of the drawer pane:

This will take you to the Test tab pane in the Signal Handler's details page.
Administrators will need to change the HMAC key to the CrowdStrike HMAC key to make CrowdStrike signal handlers function properly. Note that when the HMAC key is not updated, the default sample test event provided by HYPR for CrowdStrike will fail; the HMAC Key for the basic sample event is different.
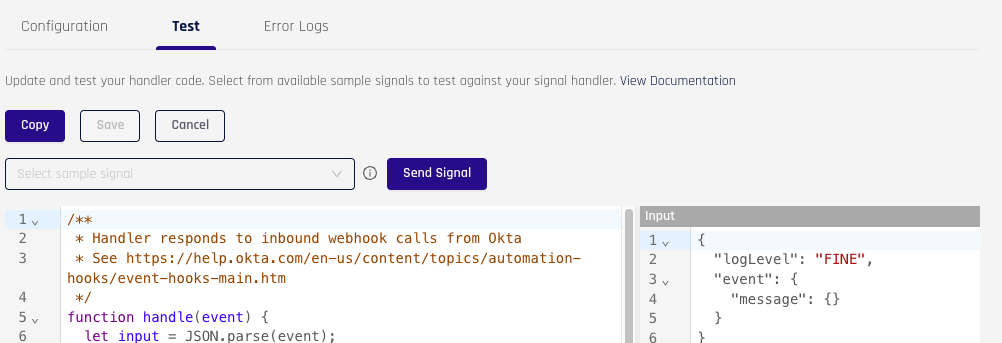
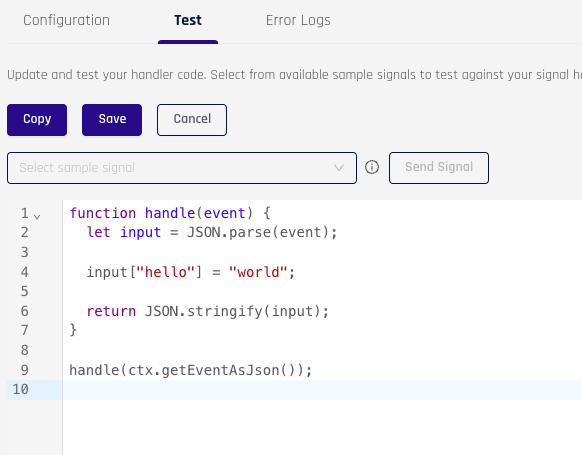
Use the right-side pane to make changes to the Signal Handler source code.* Signal Handler code is written in Javascript. After making changes to the code, click Save at the top of the pane. Changes will need to be saved before they can be tested.
Editing options are only available for custom Signal Handlers_.
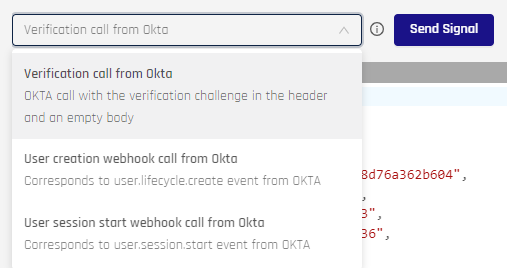
To test the Signal Handler, you will need to input a test signal into the Input panel on the page. You can either input the signal data manually, or select pre-defined samples from the select field at the top of the page.
Hovering over the info icon next to the select field will provide more information on what the acceptable schema is for a test signal.
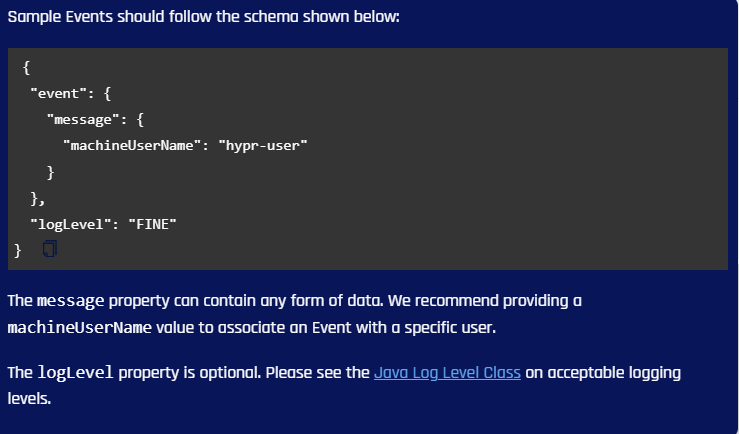
Use this as a reference when setting the input data manually.
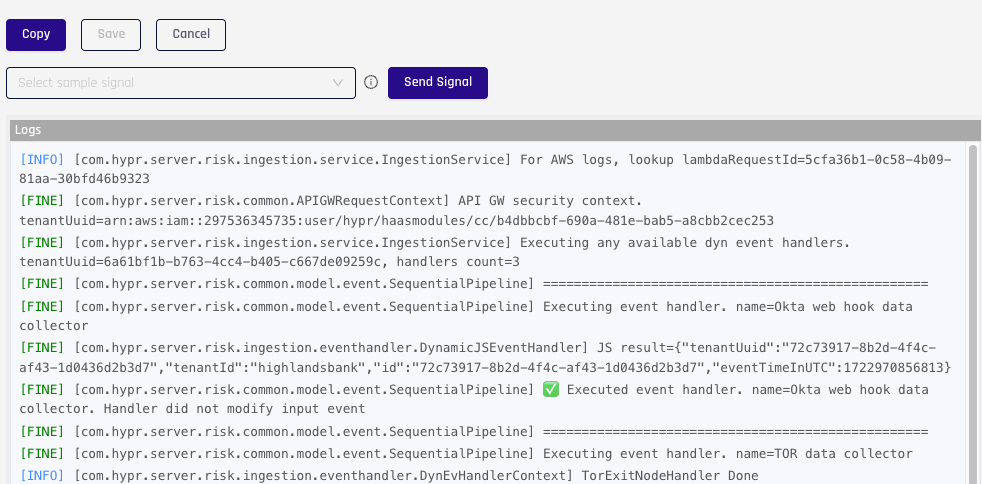
When you are satisfied with your test signal, click Send Signal to have HYPR do a test invocation of the Signal Handler; the result of the invocation will appear in the Logs pane.
Error Logs
To view the error logs for your Signal Handler, click the View Error Logs button underneath the metrics graph in the drawer pane:
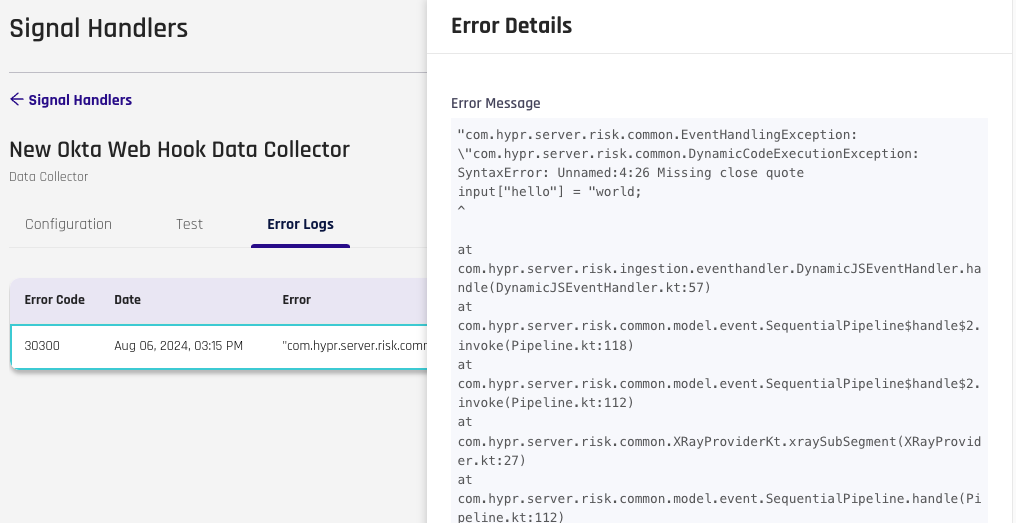
This will take you to the Error Logs tab pane in the Signal Handler's details page.

The Error Logs table will show all the failed invocations for a Signal Handler within the last 24 hours. To view further details on a specific error, select the error log in the table. This will open a drawer pane on the right side of the page. The pane will show a stack trace of the error.
Reversion
The drop-down in the upper right contains past versions of this handler. To revert to a previous version, select the desired version and clear the confirmation, then click Save. The information in all tabs will change to reflect the version-specific settings.

API
See the HYPR Adapt API for calls that manipulate HYPR Adapt information.